Northern European vs Swiss 10th Grade
COMPARE
Northern European
Swiss
10th Grade
10th Grade Comparison
Northern Europeans
Swiss
95.3%
10TH GRADE
99.9/ 100
METRIC RATING
38th/ 347
METRIC RANK
94.7%
10TH GRADE
99.1/ 100
METRIC RATING
82nd/ 347
METRIC RANK
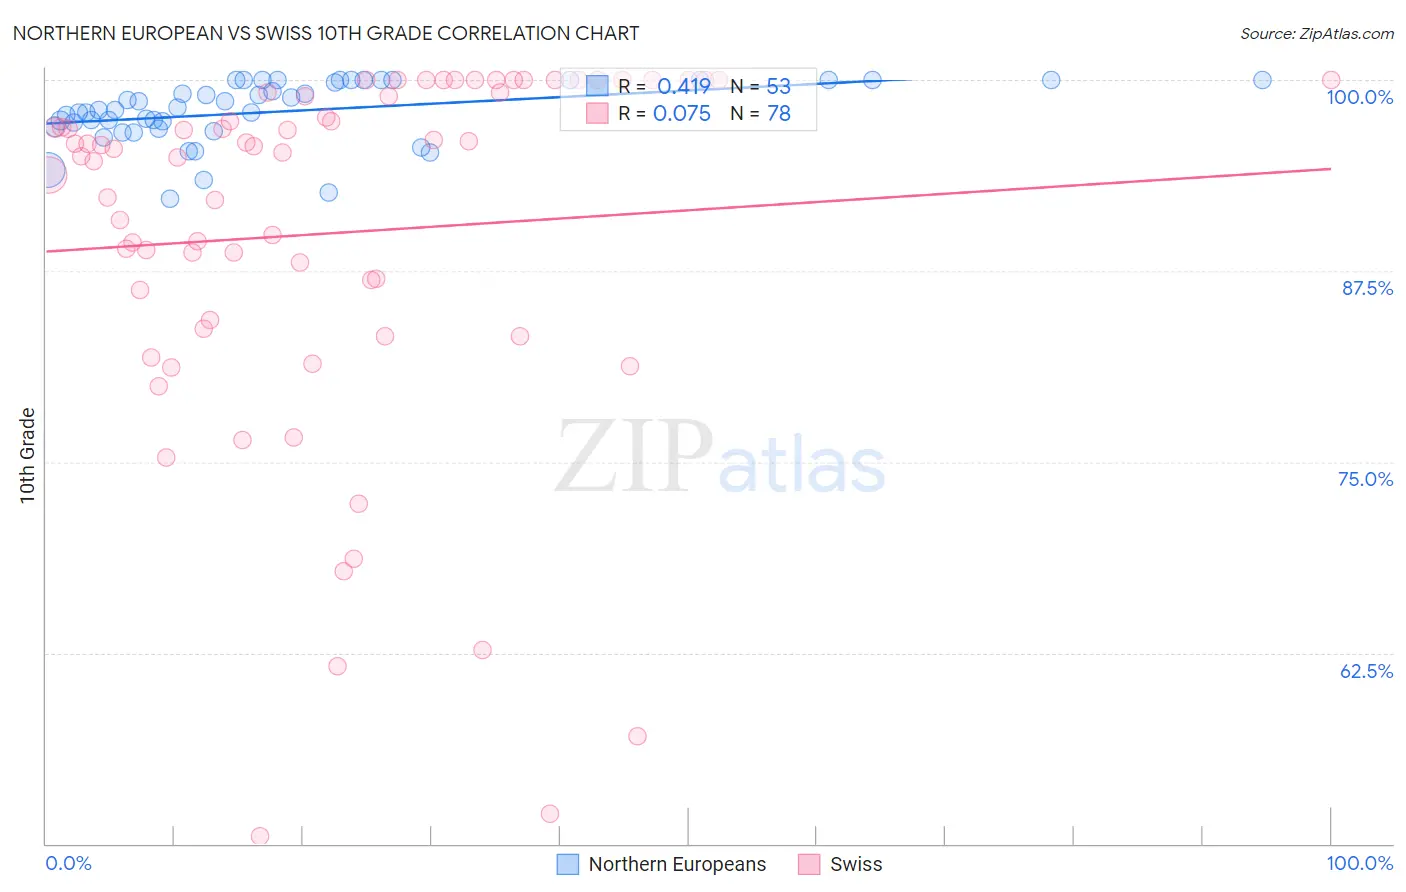
Northern European vs Swiss 10th Grade Correlation Chart
The statistical analysis conducted on geographies consisting of 406,096,351 people shows a moderate positive correlation between the proportion of Northern Europeans and percentage of population with at least 10th grade education in the United States with a correlation coefficient (R) of 0.419 and weighted average of 95.3%. Similarly, the statistical analysis conducted on geographies consisting of 465,022,572 people shows a slight positive correlation between the proportion of Swiss and percentage of population with at least 10th grade education in the United States with a correlation coefficient (R) of 0.075 and weighted average of 94.7%, a difference of 0.57%.
10th Grade Correlation Summary
| Measurement | Northern European | Swiss |
| Minimum | 92.2% | 50.5% |
| Maximum | 100.0% | 100.0% |
| Range | 7.8% | 49.5% |
| Mean | 97.9% | 90.0% |
| Median | 98.0% | 95.4% |
| Interquartile 25% (IQ1) | 96.9% | 84.3% |
| Interquartile 75% (IQ3) | 100.0% | 99.2% |
| Interquartile Range (IQR) | 3.1% | 14.9% |
| Standard Deviation (Sample) | 2.0% | 12.0% |
| Standard Deviation (Population) | 2.0% | 11.9% |
Similar Demographics by 10th Grade
Demographics Similar to Northern Europeans by 10th Grade
In terms of 10th grade, the demographic groups most similar to Northern Europeans are Immigrants from Scotland (95.2%, a difference of 0.020%), French Canadian (95.3%, a difference of 0.030%), Scotch-Irish (95.2%, a difference of 0.030%), Immigrants from India (95.3%, a difference of 0.050%), and Russian (95.2%, a difference of 0.050%).
| Demographics | Rating | Rank | 10th Grade |
| Iranians | 100.0 /100 | #31 | Exceptional 95.3% |
| Hungarians | 100.0 /100 | #32 | Exceptional 95.3% |
| French | 100.0 /100 | #33 | Exceptional 95.3% |
| British | 99.9 /100 | #34 | Exceptional 95.3% |
| Estonians | 99.9 /100 | #35 | Exceptional 95.3% |
| Immigrants | India | 99.9 /100 | #36 | Exceptional 95.3% |
| French Canadians | 99.9 /100 | #37 | Exceptional 95.3% |
| Northern Europeans | 99.9 /100 | #38 | Exceptional 95.3% |
| Immigrants | Scotland | 99.9 /100 | #39 | Exceptional 95.2% |
| Scotch-Irish | 99.9 /100 | #40 | Exceptional 95.2% |
| Russians | 99.9 /100 | #41 | Exceptional 95.2% |
| Slavs | 99.9 /100 | #42 | Exceptional 95.2% |
| Macedonians | 99.9 /100 | #43 | Exceptional 95.2% |
| Immigrants | Northern Europe | 99.9 /100 | #44 | Exceptional 95.2% |
| Greeks | 99.9 /100 | #45 | Exceptional 95.2% |
Demographics Similar to Swiss by 10th Grade
In terms of 10th grade, the demographic groups most similar to Swiss are Immigrants from Western Europe (94.7%, a difference of 0.010%), Icelander (94.7%, a difference of 0.010%), Crow (94.7%, a difference of 0.020%), Puget Sound Salish (94.7%, a difference of 0.020%), and Immigrants from Denmark (94.7%, a difference of 0.030%).
| Demographics | Rating | Rank | 10th Grade |
| Okinawans | 99.5 /100 | #75 | Exceptional 94.8% |
| Romanians | 99.5 /100 | #76 | Exceptional 94.8% |
| Immigrants | South Africa | 99.5 /100 | #77 | Exceptional 94.8% |
| Filipinos | 99.3 /100 | #78 | Exceptional 94.8% |
| Immigrants | Czechoslovakia | 99.2 /100 | #79 | Exceptional 94.7% |
| Immigrants | Denmark | 99.2 /100 | #80 | Exceptional 94.7% |
| Immigrants | Latvia | 99.2 /100 | #81 | Exceptional 94.7% |
| Swiss | 99.1 /100 | #82 | Exceptional 94.7% |
| Immigrants | Western Europe | 99.1 /100 | #83 | Exceptional 94.7% |
| Icelanders | 99.1 /100 | #84 | Exceptional 94.7% |
| Crow | 99.0 /100 | #85 | Exceptional 94.7% |
| Puget Sound Salish | 99.0 /100 | #86 | Exceptional 94.7% |
| Immigrants | Saudi Arabia | 99.0 /100 | #87 | Exceptional 94.7% |
| Immigrants | Japan | 99.0 /100 | #88 | Exceptional 94.7% |
| Immigrants | Moldova | 98.9 /100 | #89 | Exceptional 94.7% |