Northern European vs Apache 10th Grade
COMPARE
Northern European
Apache
10th Grade
10th Grade Comparison
Northern Europeans
Apache
95.3%
10TH GRADE
99.9/ 100
METRIC RATING
38th/ 347
METRIC RANK
92.6%
10TH GRADE
0.4/ 100
METRIC RATING
263rd/ 347
METRIC RANK
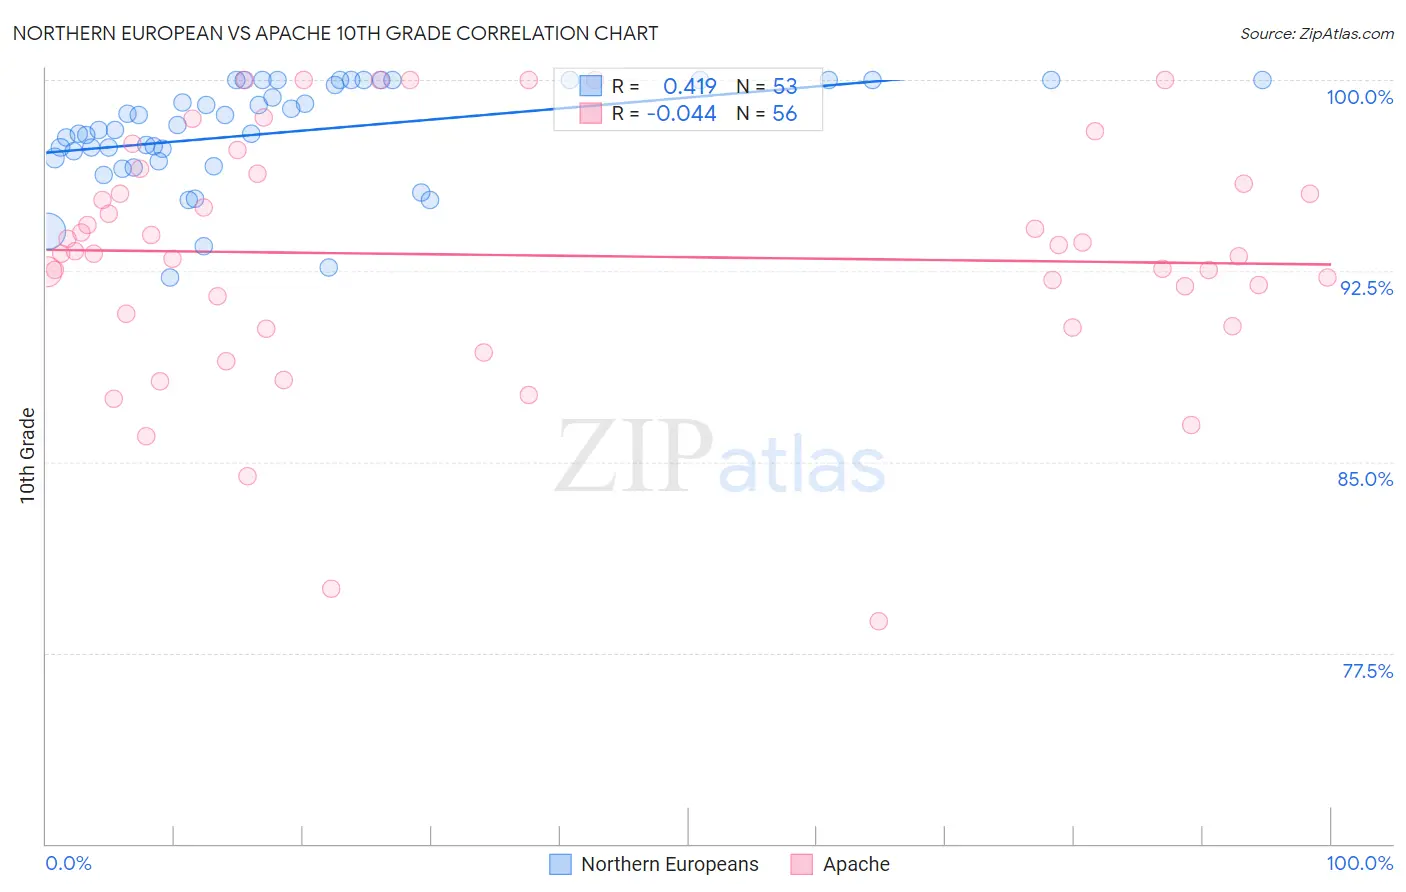
Northern European vs Apache 10th Grade Correlation Chart
The statistical analysis conducted on geographies consisting of 406,096,351 people shows a moderate positive correlation between the proportion of Northern Europeans and percentage of population with at least 10th grade education in the United States with a correlation coefficient (R) of 0.419 and weighted average of 95.3%. Similarly, the statistical analysis conducted on geographies consisting of 231,143,094 people shows no correlation between the proportion of Apache and percentage of population with at least 10th grade education in the United States with a correlation coefficient (R) of -0.044 and weighted average of 92.6%, a difference of 2.9%.
10th Grade Correlation Summary
| Measurement | Northern European | Apache |
| Minimum | 92.2% | 78.8% |
| Maximum | 100.0% | 100.0% |
| Range | 7.8% | 21.2% |
| Mean | 97.9% | 93.1% |
| Median | 98.0% | 93.2% |
| Interquartile 25% (IQ1) | 96.9% | 90.6% |
| Interquartile 75% (IQ3) | 100.0% | 96.1% |
| Interquartile Range (IQR) | 3.1% | 5.5% |
| Standard Deviation (Sample) | 2.0% | 4.7% |
| Standard Deviation (Population) | 2.0% | 4.7% |
Similar Demographics by 10th Grade
Demographics Similar to Northern Europeans by 10th Grade
In terms of 10th grade, the demographic groups most similar to Northern Europeans are Immigrants from Scotland (95.2%, a difference of 0.020%), French Canadian (95.3%, a difference of 0.030%), Scotch-Irish (95.2%, a difference of 0.030%), Immigrants from India (95.3%, a difference of 0.050%), and Russian (95.2%, a difference of 0.050%).
| Demographics | Rating | Rank | 10th Grade |
| Iranians | 100.0 /100 | #31 | Exceptional 95.3% |
| Hungarians | 100.0 /100 | #32 | Exceptional 95.3% |
| French | 100.0 /100 | #33 | Exceptional 95.3% |
| British | 99.9 /100 | #34 | Exceptional 95.3% |
| Estonians | 99.9 /100 | #35 | Exceptional 95.3% |
| Immigrants | India | 99.9 /100 | #36 | Exceptional 95.3% |
| French Canadians | 99.9 /100 | #37 | Exceptional 95.3% |
| Northern Europeans | 99.9 /100 | #38 | Exceptional 95.3% |
| Immigrants | Scotland | 99.9 /100 | #39 | Exceptional 95.2% |
| Scotch-Irish | 99.9 /100 | #40 | Exceptional 95.2% |
| Russians | 99.9 /100 | #41 | Exceptional 95.2% |
| Slavs | 99.9 /100 | #42 | Exceptional 95.2% |
| Macedonians | 99.9 /100 | #43 | Exceptional 95.2% |
| Immigrants | Northern Europe | 99.9 /100 | #44 | Exceptional 95.2% |
| Greeks | 99.9 /100 | #45 | Exceptional 95.2% |
Demographics Similar to Apache by 10th Grade
In terms of 10th grade, the demographic groups most similar to Apache are Immigrants from South America (92.6%, a difference of 0.0%), Peruvian (92.6%, a difference of 0.0%), Paiute (92.6%, a difference of 0.010%), Dutch West Indian (92.6%, a difference of 0.030%), and Immigrants from Philippines (92.6%, a difference of 0.030%).
| Demographics | Rating | Rank | 10th Grade |
| Immigrants | Nigeria | 0.7 /100 | #256 | Tragic 92.7% |
| U.S. Virgin Islanders | 0.7 /100 | #257 | Tragic 92.7% |
| Immigrants | Costa Rica | 0.6 /100 | #258 | Tragic 92.7% |
| Immigrants | Jamaica | 0.5 /100 | #259 | Tragic 92.6% |
| Immigrants | Uzbekistan | 0.5 /100 | #260 | Tragic 92.6% |
| Paiute | 0.4 /100 | #261 | Tragic 92.6% |
| Immigrants | South America | 0.4 /100 | #262 | Tragic 92.6% |
| Apache | 0.4 /100 | #263 | Tragic 92.6% |
| Peruvians | 0.4 /100 | #264 | Tragic 92.6% |
| Dutch West Indians | 0.4 /100 | #265 | Tragic 92.6% |
| Immigrants | Philippines | 0.4 /100 | #266 | Tragic 92.6% |
| Taiwanese | 0.3 /100 | #267 | Tragic 92.5% |
| Immigrants | Ghana | 0.3 /100 | #268 | Tragic 92.5% |
| Immigrants | Colombia | 0.3 /100 | #269 | Tragic 92.5% |
| Immigrants | Uruguay | 0.3 /100 | #270 | Tragic 92.5% |