Nigerian vs Immigrants from Northern Africa Kindergarten
COMPARE
Nigerian
Immigrants from Northern Africa
Kindergarten
Kindergarten Comparison
Nigerians
Immigrants from Northern Africa
97.6%
KINDERGARTEN
1.8/ 100
METRIC RATING
237th/ 347
METRIC RANK
97.8%
KINDERGARTEN
12.0/ 100
METRIC RATING
208th/ 347
METRIC RANK
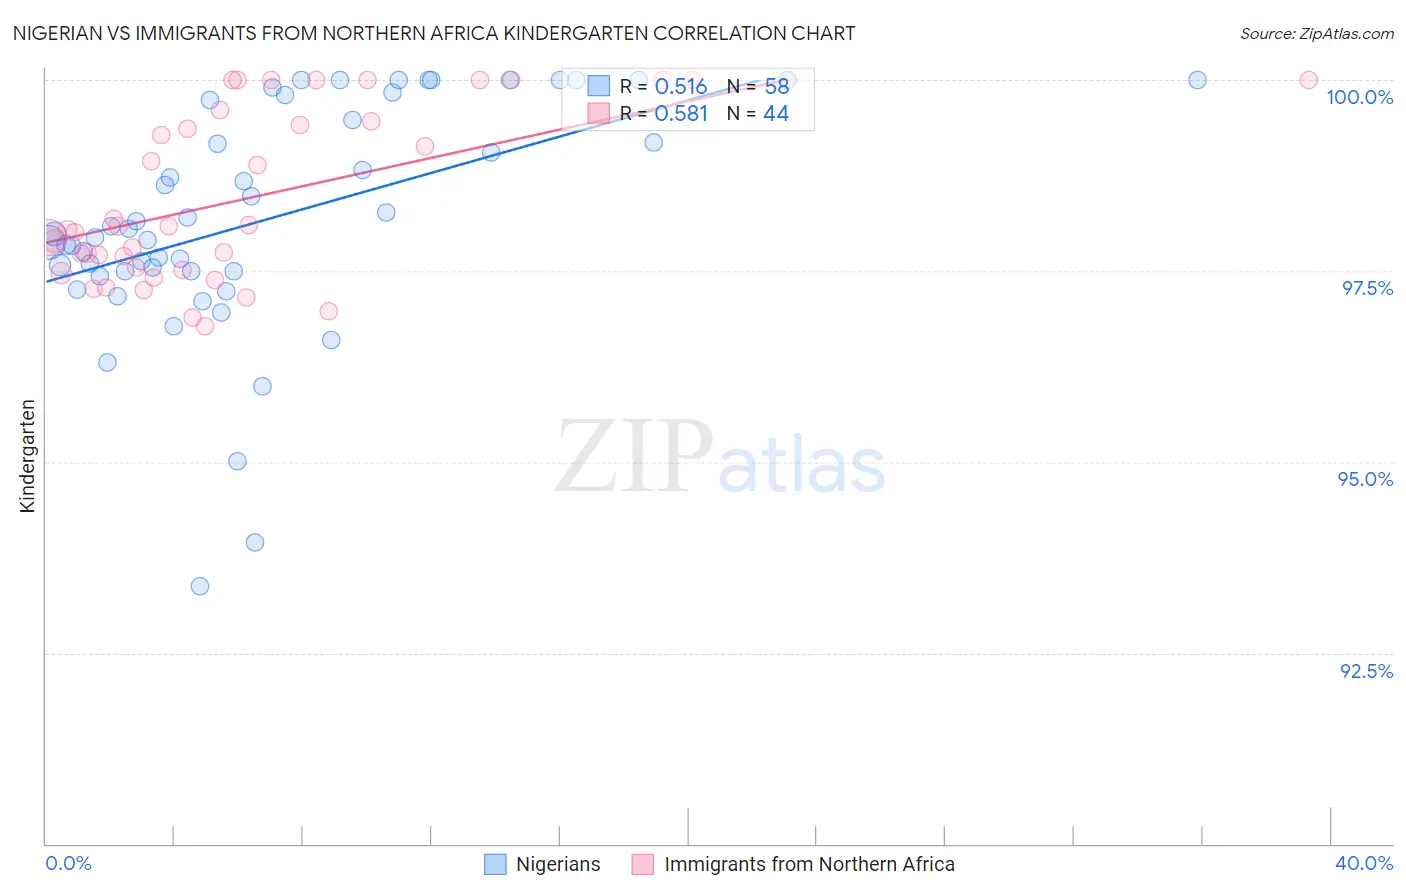
Nigerian vs Immigrants from Northern Africa Kindergarten Correlation Chart
The statistical analysis conducted on geographies consisting of 332,724,627 people shows a substantial positive correlation between the proportion of Nigerians and percentage of population with at least kindergarten education in the United States with a correlation coefficient (R) of 0.516 and weighted average of 97.6%. Similarly, the statistical analysis conducted on geographies consisting of 321,196,768 people shows a substantial positive correlation between the proportion of Immigrants from Northern Africa and percentage of population with at least kindergarten education in the United States with a correlation coefficient (R) of 0.581 and weighted average of 97.8%, a difference of 0.16%.
Kindergarten Correlation Summary
| Measurement | Nigerian | Immigrants from Northern Africa |
| Minimum | 93.4% | 96.8% |
| Maximum | 100.0% | 100.0% |
| Range | 6.6% | 3.2% |
| Mean | 98.2% | 98.4% |
| Median | 98.0% | 98.1% |
| Interquartile 25% (IQ1) | 97.5% | 97.5% |
| Interquartile 75% (IQ3) | 99.7% | 99.5% |
| Interquartile Range (IQR) | 2.2% | 2.0% |
| Standard Deviation (Sample) | 1.5% | 1.1% |
| Standard Deviation (Population) | 1.5% | 1.1% |
Similar Demographics by Kindergarten
Demographics Similar to Nigerians by Kindergarten
In terms of kindergarten, the demographic groups most similar to Nigerians are Immigrants from Eastern Asia (97.6%, a difference of 0.0%), U.S. Virgin Islander (97.6%, a difference of 0.0%), Immigrants from Western Asia (97.7%, a difference of 0.010%), Korean (97.6%, a difference of 0.010%), and Immigrants from Pakistan (97.7%, a difference of 0.020%).
| Demographics | Rating | Rank | Kindergarten |
| Senegalese | 3.3 /100 | #230 | Tragic 97.7% |
| Puerto Ricans | 2.7 /100 | #231 | Tragic 97.7% |
| Immigrants | Uruguay | 2.6 /100 | #232 | Tragic 97.7% |
| Immigrants | Pakistan | 2.2 /100 | #233 | Tragic 97.7% |
| Immigrants | Malaysia | 2.2 /100 | #234 | Tragic 97.7% |
| Colombians | 2.2 /100 | #235 | Tragic 97.7% |
| Immigrants | Western Asia | 2.1 /100 | #236 | Tragic 97.7% |
| Nigerians | 1.8 /100 | #237 | Tragic 97.6% |
| Immigrants | Eastern Asia | 1.7 /100 | #238 | Tragic 97.6% |
| U.S. Virgin Islanders | 1.7 /100 | #239 | Tragic 97.6% |
| Koreans | 1.6 /100 | #240 | Tragic 97.6% |
| Liberians | 1.3 /100 | #241 | Tragic 97.6% |
| Immigrants | Indonesia | 1.3 /100 | #242 | Tragic 97.6% |
| Asians | 1.2 /100 | #243 | Tragic 97.6% |
| Bolivians | 1.2 /100 | #244 | Tragic 97.6% |
Demographics Similar to Immigrants from Northern Africa by Kindergarten
In terms of kindergarten, the demographic groups most similar to Immigrants from Northern Africa are Costa Rican (97.8%, a difference of 0.0%), Immigrants from Oceania (97.8%, a difference of 0.010%), Laotian (97.8%, a difference of 0.010%), Immigrants from Albania (97.8%, a difference of 0.030%), and African (97.8%, a difference of 0.030%).
| Demographics | Rating | Rank | Kindergarten |
| Immigrants | Lebanon | 20.9 /100 | #201 | Fair 97.9% |
| Immigrants | Ukraine | 19.1 /100 | #202 | Poor 97.8% |
| Immigrants | Uganda | 18.8 /100 | #203 | Poor 97.8% |
| Immigrants | Chile | 18.1 /100 | #204 | Poor 97.8% |
| Immigrants | Southern Europe | 18.0 /100 | #205 | Poor 97.8% |
| Immigrants | Albania | 16.4 /100 | #206 | Poor 97.8% |
| Africans | 16.1 /100 | #207 | Poor 97.8% |
| Immigrants | Northern Africa | 12.0 /100 | #208 | Poor 97.8% |
| Costa Ricans | 11.6 /100 | #209 | Poor 97.8% |
| Immigrants | Oceania | 11.1 /100 | #210 | Poor 97.8% |
| Laotians | 10.5 /100 | #211 | Poor 97.8% |
| Moroccans | 8.9 /100 | #212 | Tragic 97.8% |
| South American Indians | 7.7 /100 | #213 | Tragic 97.8% |
| Uruguayans | 7.5 /100 | #214 | Tragic 97.8% |
| Immigrants | Bahamas | 7.4 /100 | #215 | Tragic 97.8% |