New Zealander vs Immigrants from El Salvador 6th Grade
COMPARE
New Zealander
Immigrants from El Salvador
6th Grade
6th Grade Comparison
New Zealanders
Immigrants from El Salvador
97.7%
6TH GRADE
99.6/ 100
METRIC RATING
66th/ 347
METRIC RANK
93.6%
6TH GRADE
0.0/ 100
METRIC RATING
347th/ 347
METRIC RANK
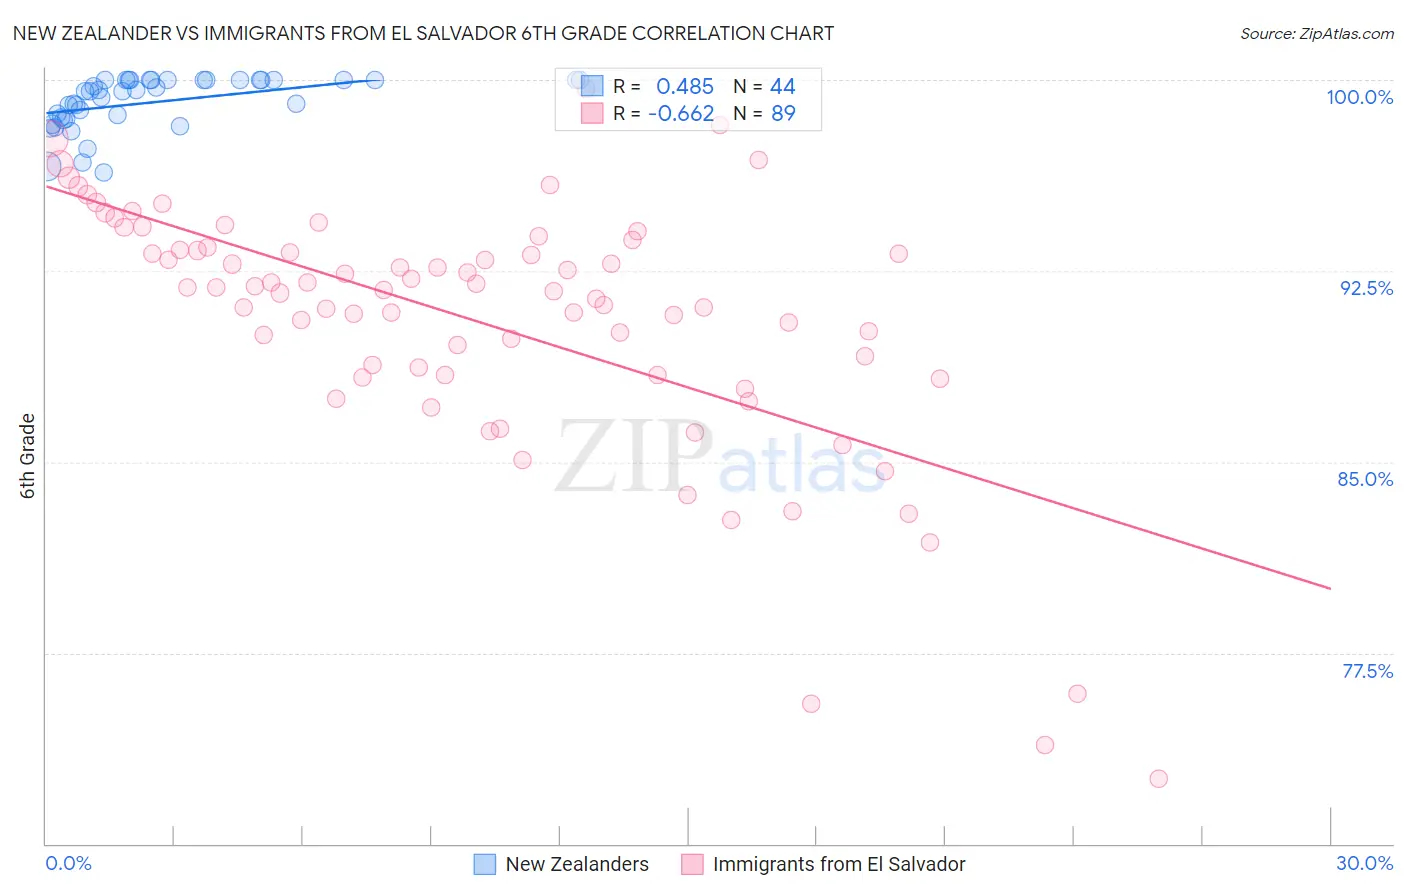
New Zealander vs Immigrants from El Salvador 6th Grade Correlation Chart
The statistical analysis conducted on geographies consisting of 106,912,544 people shows a moderate positive correlation between the proportion of New Zealanders and percentage of population with at least 6th grade education in the United States with a correlation coefficient (R) of 0.485 and weighted average of 97.7%. Similarly, the statistical analysis conducted on geographies consisting of 357,852,634 people shows a significant negative correlation between the proportion of Immigrants from El Salvador and percentage of population with at least 6th grade education in the United States with a correlation coefficient (R) of -0.662 and weighted average of 93.6%, a difference of 4.4%.
6th Grade Correlation Summary
| Measurement | New Zealander | Immigrants from El Salvador |
| Minimum | 96.4% | 72.5% |
| Maximum | 100.0% | 99.7% |
| Range | 3.6% | 27.1% |
| Mean | 99.1% | 90.5% |
| Median | 99.6% | 91.8% |
| Interquartile 25% (IQ1) | 98.5% | 88.4% |
| Interquartile 75% (IQ3) | 100.0% | 93.4% |
| Interquartile Range (IQR) | 1.5% | 4.9% |
| Standard Deviation (Sample) | 1.0% | 5.0% |
| Standard Deviation (Population) | 1.0% | 5.0% |
Similar Demographics by 6th Grade
Demographics Similar to New Zealanders by 6th Grade
In terms of 6th grade, the demographic groups most similar to New Zealanders are Immigrants from Northern Europe (97.7%, a difference of 0.0%), Kiowa (97.7%, a difference of 0.0%), Immigrants from Austria (97.7%, a difference of 0.0%), Canadian (97.7%, a difference of 0.010%), and Russian (97.7%, a difference of 0.020%).
| Demographics | Rating | Rank | 6th Grade |
| Americans | 99.8 /100 | #59 | Exceptional 97.7% |
| Immigrants | Canada | 99.8 /100 | #60 | Exceptional 97.7% |
| Serbians | 99.7 /100 | #61 | Exceptional 97.7% |
| Immigrants | North America | 99.7 /100 | #62 | Exceptional 97.7% |
| Russians | 99.7 /100 | #63 | Exceptional 97.7% |
| Canadians | 99.7 /100 | #64 | Exceptional 97.7% |
| Immigrants | Northern Europe | 99.6 /100 | #65 | Exceptional 97.7% |
| New Zealanders | 99.6 /100 | #66 | Exceptional 97.7% |
| Kiowa | 99.6 /100 | #67 | Exceptional 97.7% |
| Immigrants | Austria | 99.6 /100 | #68 | Exceptional 97.7% |
| Iranians | 99.6 /100 | #69 | Exceptional 97.6% |
| Cajuns | 99.5 /100 | #70 | Exceptional 97.6% |
| Chickasaw | 99.5 /100 | #71 | Exceptional 97.6% |
| Macedonians | 99.4 /100 | #72 | Exceptional 97.6% |
| Cherokee | 99.4 /100 | #73 | Exceptional 97.6% |
Demographics Similar to Immigrants from El Salvador by 6th Grade
In terms of 6th grade, the demographic groups most similar to Immigrants from El Salvador are Spanish American Indian (93.6%, a difference of 0.040%), Immigrants from Mexico (93.9%, a difference of 0.38%), Immigrants from Guatemala (93.9%, a difference of 0.38%), Salvadoran (93.9%, a difference of 0.38%), and Immigrants from Central America (94.0%, a difference of 0.44%).
| Demographics | Rating | Rank | 6th Grade |
| Immigrants | Latin America | 0.0 /100 | #333 | Tragic 94.7% |
| Immigrants | Azores | 0.0 /100 | #334 | Tragic 94.7% |
| Mexicans | 0.0 /100 | #335 | Tragic 94.6% |
| Immigrants | Dominican Republic | 0.0 /100 | #336 | Tragic 94.6% |
| Central Americans | 0.0 /100 | #337 | Tragic 94.5% |
| Immigrants | Cabo Verde | 0.0 /100 | #338 | Tragic 94.4% |
| Yakama | 0.0 /100 | #339 | Tragic 94.3% |
| Guatemalans | 0.0 /100 | #340 | Tragic 94.2% |
| Immigrants | Yemen | 0.0 /100 | #341 | Tragic 94.1% |
| Immigrants | Central America | 0.0 /100 | #342 | Tragic 94.0% |
| Immigrants | Mexico | 0.0 /100 | #343 | Tragic 93.9% |
| Immigrants | Guatemala | 0.0 /100 | #344 | Tragic 93.9% |
| Salvadorans | 0.0 /100 | #345 | Tragic 93.9% |
| Spanish American Indians | 0.0 /100 | #346 | Tragic 93.6% |
| Immigrants | El Salvador | 0.0 /100 | #347 | Tragic 93.6% |