New Zealander vs Bulgarian 6th Grade
COMPARE
New Zealander
Bulgarian
6th Grade
6th Grade Comparison
New Zealanders
Bulgarians
97.7%
6TH GRADE
99.6/ 100
METRIC RATING
66th/ 347
METRIC RANK
97.8%
6TH GRADE
99.9/ 100
METRIC RATING
45th/ 347
METRIC RANK
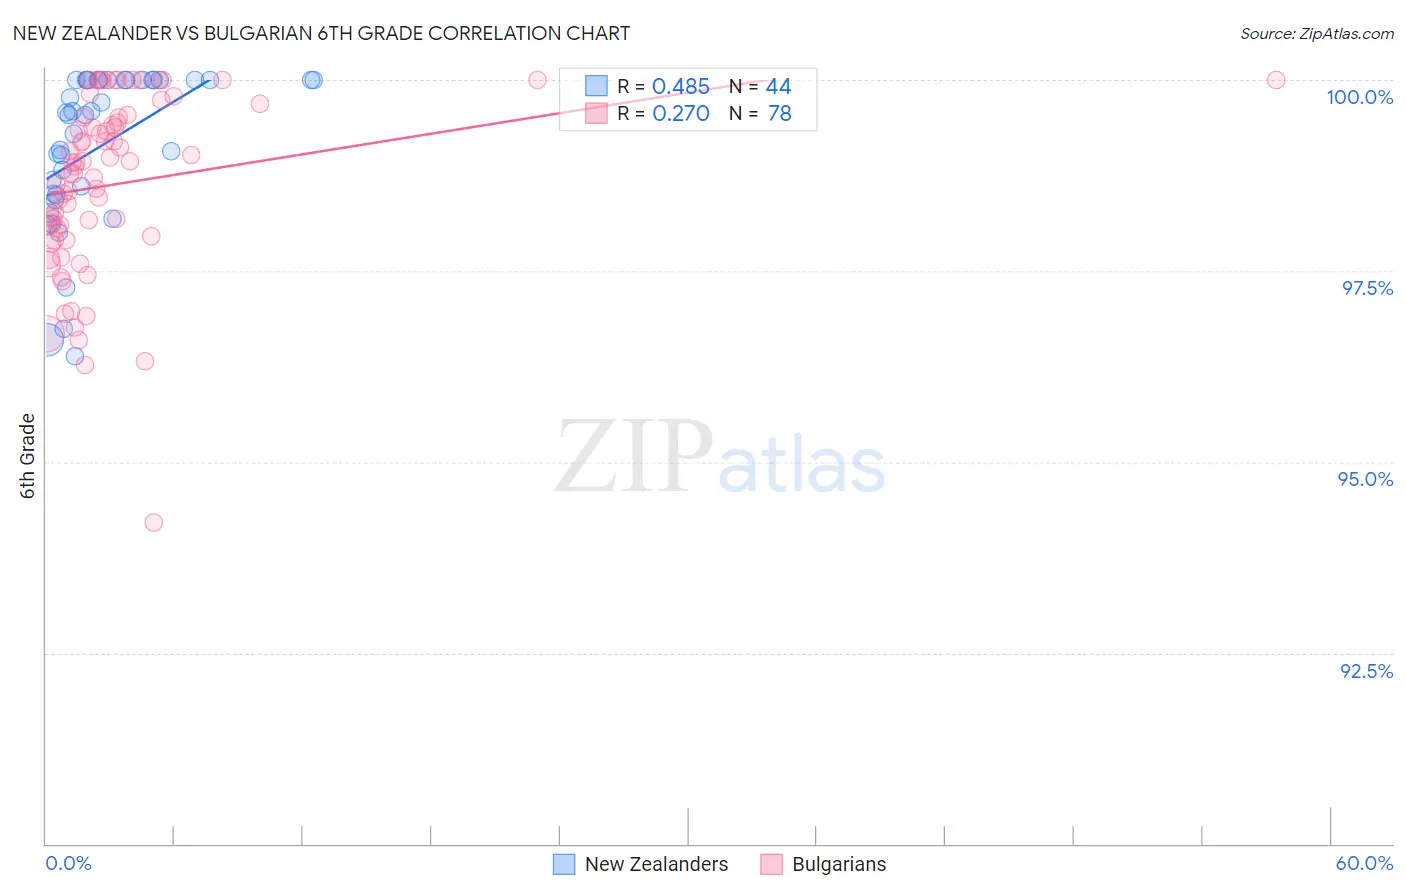
New Zealander vs Bulgarian 6th Grade Correlation Chart
The statistical analysis conducted on geographies consisting of 106,912,544 people shows a moderate positive correlation between the proportion of New Zealanders and percentage of population with at least 6th grade education in the United States with a correlation coefficient (R) of 0.485 and weighted average of 97.7%. Similarly, the statistical analysis conducted on geographies consisting of 205,633,223 people shows a weak positive correlation between the proportion of Bulgarians and percentage of population with at least 6th grade education in the United States with a correlation coefficient (R) of 0.270 and weighted average of 97.8%, a difference of 0.12%.
6th Grade Correlation Summary
| Measurement | New Zealander | Bulgarian |
| Minimum | 96.4% | 94.2% |
| Maximum | 100.0% | 100.0% |
| Range | 3.6% | 5.8% |
| Mean | 99.1% | 98.6% |
| Median | 99.6% | 98.9% |
| Interquartile 25% (IQ1) | 98.5% | 98.0% |
| Interquartile 75% (IQ3) | 100.0% | 99.5% |
| Interquartile Range (IQR) | 1.5% | 1.6% |
| Standard Deviation (Sample) | 1.0% | 1.1% |
| Standard Deviation (Population) | 1.0% | 1.1% |
Similar Demographics by 6th Grade
Demographics Similar to New Zealanders by 6th Grade
In terms of 6th grade, the demographic groups most similar to New Zealanders are Immigrants from Northern Europe (97.7%, a difference of 0.0%), Kiowa (97.7%, a difference of 0.0%), Immigrants from Austria (97.7%, a difference of 0.0%), Canadian (97.7%, a difference of 0.010%), and Russian (97.7%, a difference of 0.020%).
| Demographics | Rating | Rank | 6th Grade |
| Americans | 99.8 /100 | #59 | Exceptional 97.7% |
| Immigrants | Canada | 99.8 /100 | #60 | Exceptional 97.7% |
| Serbians | 99.7 /100 | #61 | Exceptional 97.7% |
| Immigrants | North America | 99.7 /100 | #62 | Exceptional 97.7% |
| Russians | 99.7 /100 | #63 | Exceptional 97.7% |
| Canadians | 99.7 /100 | #64 | Exceptional 97.7% |
| Immigrants | Northern Europe | 99.6 /100 | #65 | Exceptional 97.7% |
| New Zealanders | 99.6 /100 | #66 | Exceptional 97.7% |
| Kiowa | 99.6 /100 | #67 | Exceptional 97.7% |
| Immigrants | Austria | 99.6 /100 | #68 | Exceptional 97.7% |
| Iranians | 99.6 /100 | #69 | Exceptional 97.6% |
| Cajuns | 99.5 /100 | #70 | Exceptional 97.6% |
| Chickasaw | 99.5 /100 | #71 | Exceptional 97.6% |
| Macedonians | 99.4 /100 | #72 | Exceptional 97.6% |
| Cherokee | 99.4 /100 | #73 | Exceptional 97.6% |
Demographics Similar to Bulgarians by 6th Grade
In terms of 6th grade, the demographic groups most similar to Bulgarians are Arapaho (97.8%, a difference of 0.010%), Czechoslovakian (97.8%, a difference of 0.020%), Native Hawaiian (97.8%, a difference of 0.020%), Celtic (97.8%, a difference of 0.020%), and Estonian (97.8%, a difference of 0.020%).
| Demographics | Rating | Rank | 6th Grade |
| Belgians | 100.0 /100 | #38 | Exceptional 97.9% |
| Luxembourgers | 99.9 /100 | #39 | Exceptional 97.9% |
| Latvians | 99.9 /100 | #40 | Exceptional 97.9% |
| Eastern Europeans | 99.9 /100 | #41 | Exceptional 97.9% |
| Hungarians | 99.9 /100 | #42 | Exceptional 97.8% |
| Northern Europeans | 99.9 /100 | #43 | Exceptional 97.8% |
| Czechoslovakians | 99.9 /100 | #44 | Exceptional 97.8% |
| Bulgarians | 99.9 /100 | #45 | Exceptional 97.8% |
| Arapaho | 99.9 /100 | #46 | Exceptional 97.8% |
| Native Hawaiians | 99.9 /100 | #47 | Exceptional 97.8% |
| Celtics | 99.9 /100 | #48 | Exceptional 97.8% |
| Estonians | 99.8 /100 | #49 | Exceptional 97.8% |
| Immigrants | Scotland | 99.8 /100 | #50 | Exceptional 97.8% |
| Maltese | 99.8 /100 | #51 | Exceptional 97.8% |
| Australians | 99.8 /100 | #52 | Exceptional 97.8% |