Navajo vs Yaqui Nursery School
COMPARE
Navajo
Yaqui
Nursery School
Nursery School Comparison
Navajo
Yaqui
98.0%
NURSERY SCHOOL
50.0/ 100
METRIC RATING
174th/ 347
METRIC RANK
97.6%
NURSERY SCHOOL
0.6/ 100
METRIC RATING
256th/ 347
METRIC RANK
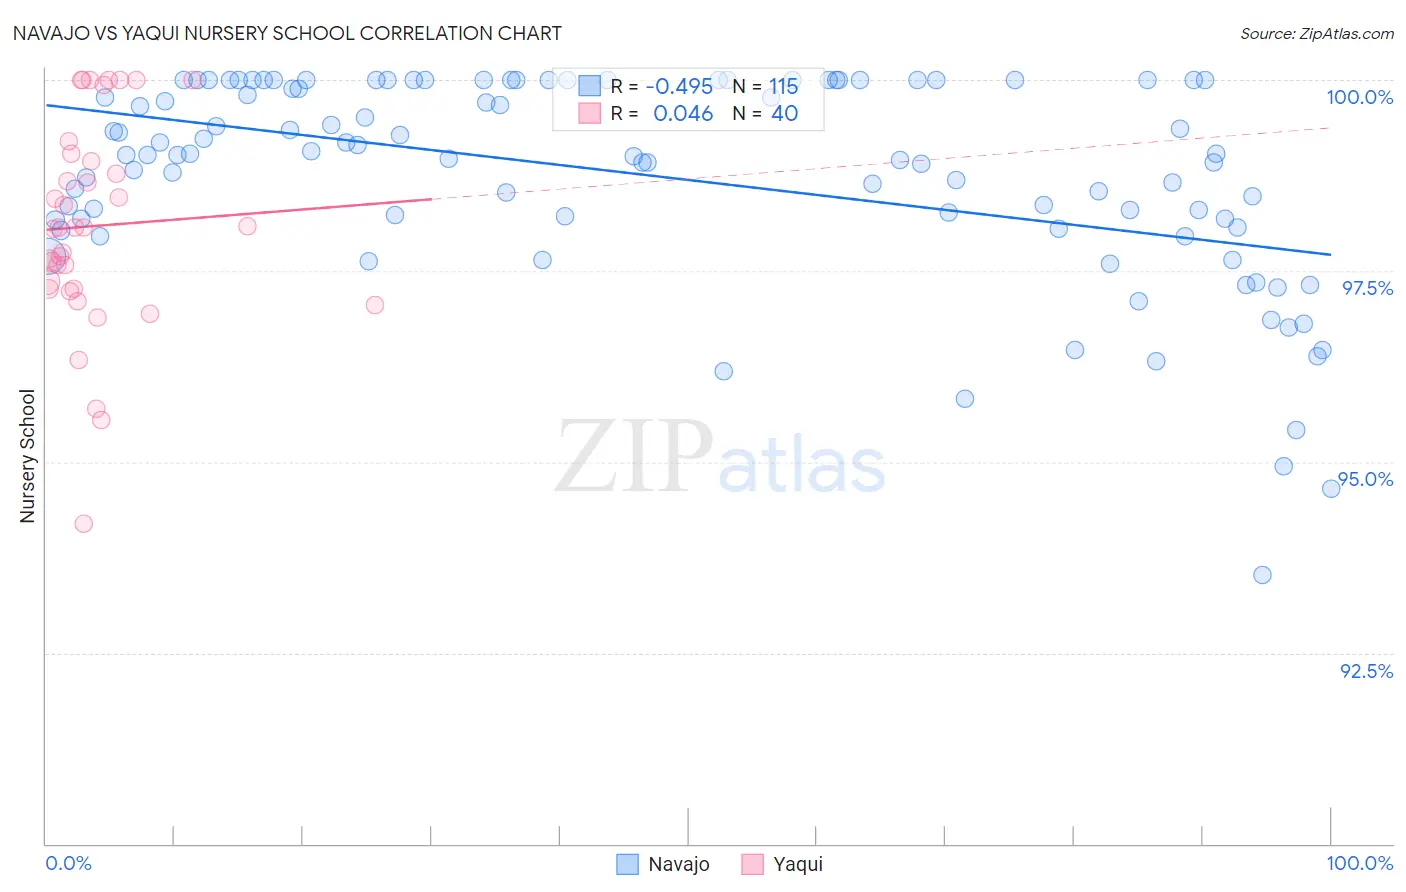
Navajo vs Yaqui Nursery School Correlation Chart
The statistical analysis conducted on geographies consisting of 224,872,493 people shows a moderate negative correlation between the proportion of Navajo and percentage of population with at least nursery school education in the United States with a correlation coefficient (R) of -0.495 and weighted average of 98.0%. Similarly, the statistical analysis conducted on geographies consisting of 107,732,380 people shows no correlation between the proportion of Yaqui and percentage of population with at least nursery school education in the United States with a correlation coefficient (R) of 0.046 and weighted average of 97.6%, a difference of 0.38%.
Nursery School Correlation Summary
| Measurement | Navajo | Yaqui |
| Minimum | 93.5% | 94.2% |
| Maximum | 100.0% | 100.0% |
| Range | 6.5% | 5.8% |
| Mean | 98.7% | 98.1% |
| Median | 99.0% | 98.1% |
| Interquartile 25% (IQ1) | 98.2% | 97.3% |
| Interquartile 75% (IQ3) | 100.0% | 99.0% |
| Interquartile Range (IQR) | 1.8% | 1.7% |
| Standard Deviation (Sample) | 1.3% | 1.4% |
| Standard Deviation (Population) | 1.3% | 1.3% |
Similar Demographics by Nursery School
Demographics Similar to Navajo by Nursery School
In terms of nursery school, the demographic groups most similar to Navajo are Immigrants from Brazil (98.0%, a difference of 0.0%), Kenyan (98.0%, a difference of 0.0%), Immigrants from Sri Lanka (98.0%, a difference of 0.0%), Immigrants from Venezuela (98.0%, a difference of 0.0%), and Albanian (98.0%, a difference of 0.0%).
| Demographics | Rating | Rank | Nursery School |
| Immigrants | Spain | 55.6 /100 | #167 | Average 98.0% |
| Immigrants | Micronesia | 55.0 /100 | #168 | Average 98.0% |
| Immigrants | Korea | 53.8 /100 | #169 | Average 98.0% |
| Bermudans | 53.7 /100 | #170 | Average 98.0% |
| Immigrants | Jordan | 53.4 /100 | #171 | Average 98.0% |
| Immigrants | Brazil | 51.3 /100 | #172 | Average 98.0% |
| Kenyans | 50.2 /100 | #173 | Average 98.0% |
| Navajo | 50.0 /100 | #174 | Average 98.0% |
| Immigrants | Sri Lanka | 49.9 /100 | #175 | Average 98.0% |
| Immigrants | Venezuela | 49.8 /100 | #176 | Average 98.0% |
| Albanians | 48.9 /100 | #177 | Average 98.0% |
| Natives/Alaskans | 48.6 /100 | #178 | Average 98.0% |
| Argentineans | 46.8 /100 | #179 | Average 98.0% |
| Immigrants | Bosnia and Herzegovina | 45.6 /100 | #180 | Average 98.0% |
| Egyptians | 42.8 /100 | #181 | Average 98.0% |
Demographics Similar to Yaqui by Nursery School
In terms of nursery school, the demographic groups most similar to Yaqui are Immigrants from Colombia (97.6%, a difference of 0.0%), Immigrants from Africa (97.6%, a difference of 0.010%), Immigrants from Iraq (97.6%, a difference of 0.010%), Immigrants from Congo (97.6%, a difference of 0.010%), and Immigrants from Asia (97.6%, a difference of 0.010%).
| Demographics | Rating | Rank | Nursery School |
| Immigrants | Eastern Africa | 0.9 /100 | #249 | Tragic 97.6% |
| Immigrants | Senegal | 0.9 /100 | #250 | Tragic 97.6% |
| Ethiopians | 0.8 /100 | #251 | Tragic 97.6% |
| Immigrants | Africa | 0.8 /100 | #252 | Tragic 97.6% |
| Immigrants | Iraq | 0.7 /100 | #253 | Tragic 97.6% |
| Immigrants | Congo | 0.7 /100 | #254 | Tragic 97.6% |
| Immigrants | Asia | 0.7 /100 | #255 | Tragic 97.6% |
| Yaqui | 0.6 /100 | #256 | Tragic 97.6% |
| Immigrants | Colombia | 0.6 /100 | #257 | Tragic 97.6% |
| Jamaicans | 0.6 /100 | #258 | Tragic 97.6% |
| Armenians | 0.4 /100 | #259 | Tragic 97.6% |
| Immigrants | South America | 0.4 /100 | #260 | Tragic 97.6% |
| Cubans | 0.4 /100 | #261 | Tragic 97.6% |
| Immigrants | Ethiopia | 0.4 /100 | #262 | Tragic 97.6% |
| Fijians | 0.3 /100 | #263 | Tragic 97.6% |