Navajo vs Nonimmigrants Kindergarten
COMPARE
Navajo
Nonimmigrants
Kindergarten
Kindergarten Comparison
Navajo
Nonimmigrants
98.0%
KINDERGARTEN
54.4/ 100
METRIC RATING
168th/ 347
METRIC RANK
98.3%
KINDERGARTEN
98.3/ 100
METRIC RATING
96th/ 347
METRIC RANK
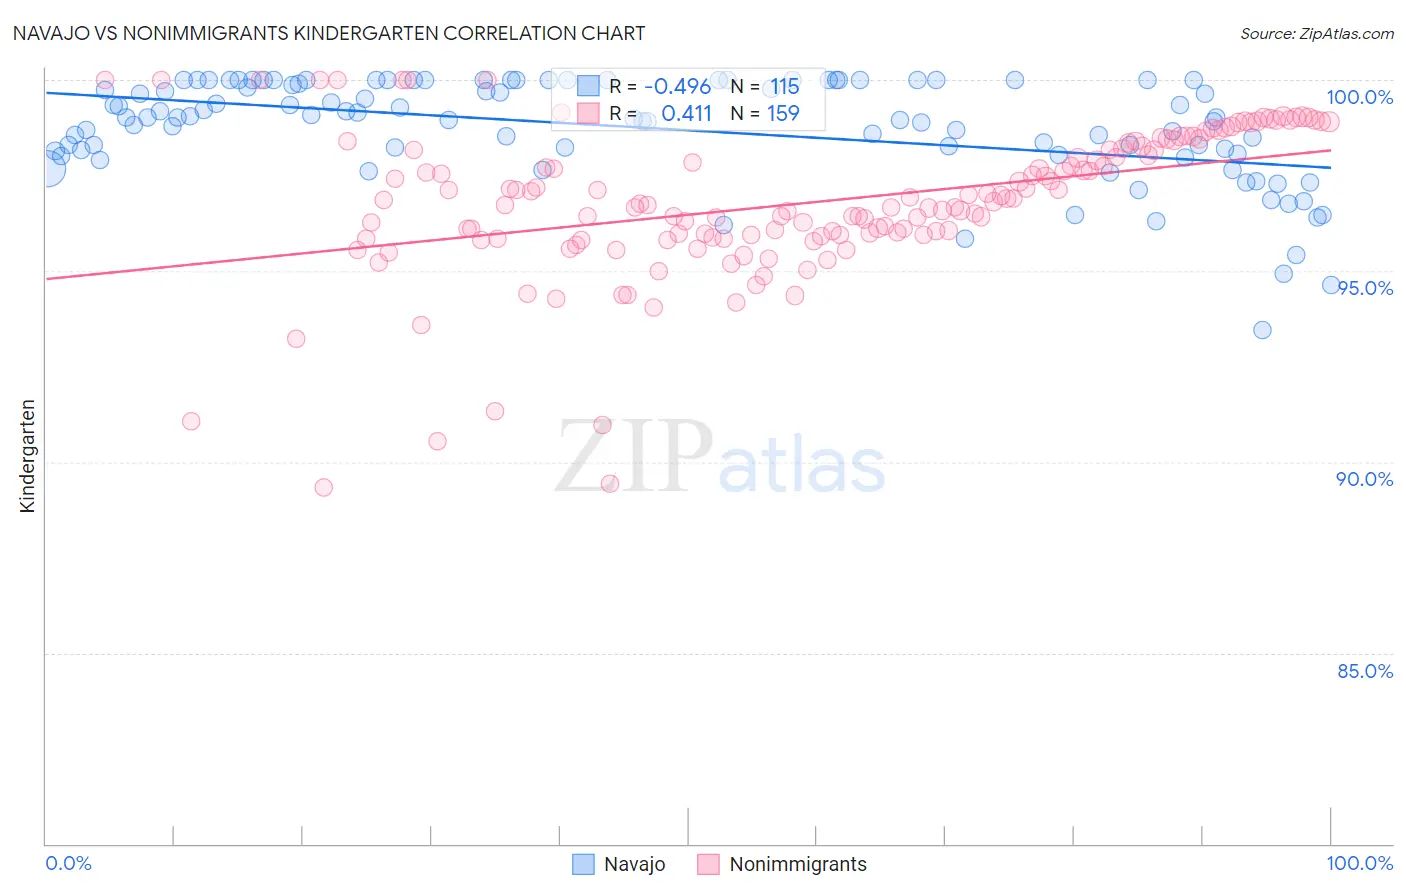
Navajo vs Nonimmigrants Kindergarten Correlation Chart
The statistical analysis conducted on geographies consisting of 224,872,493 people shows a moderate negative correlation between the proportion of Navajo and percentage of population with at least kindergarten education in the United States with a correlation coefficient (R) of -0.496 and weighted average of 98.0%. Similarly, the statistical analysis conducted on geographies consisting of 585,374,774 people shows a moderate positive correlation between the proportion of Nonimmigrants and percentage of population with at least kindergarten education in the United States with a correlation coefficient (R) of 0.411 and weighted average of 98.3%, a difference of 0.30%.
Kindergarten Correlation Summary
| Measurement | Navajo | Nonimmigrants |
| Minimum | 93.4% | 89.3% |
| Maximum | 100.0% | 100.0% |
| Range | 6.6% | 10.7% |
| Mean | 98.7% | 96.8% |
| Median | 99.0% | 96.8% |
| Interquartile 25% (IQ1) | 98.1% | 95.9% |
| Interquartile 75% (IQ3) | 100.0% | 98.3% |
| Interquartile Range (IQR) | 1.9% | 2.4% |
| Standard Deviation (Sample) | 1.3% | 1.9% |
| Standard Deviation (Population) | 1.3% | 1.9% |
Similar Demographics by Kindergarten
Demographics Similar to Navajo by Kindergarten
In terms of kindergarten, the demographic groups most similar to Navajo are Immigrants from Spain (98.0%, a difference of 0.0%), Immigrants from Korea (98.0%, a difference of 0.0%), Bermudan (98.0%, a difference of 0.0%), Immigrants from Jordan (98.0%, a difference of 0.0%), and Immigrants from Eastern Europe (98.0%, a difference of 0.010%).
| Demographics | Rating | Rank | Kindergarten |
| Immigrants | Eastern Europe | 59.0 /100 | #161 | Average 98.0% |
| Immigrants | Italy | 58.9 /100 | #162 | Average 98.0% |
| Spanish Americans | 57.8 /100 | #163 | Average 98.0% |
| Immigrants | Micronesia | 57.7 /100 | #164 | Average 98.0% |
| Ugandans | 56.9 /100 | #165 | Average 98.0% |
| Chileans | 56.3 /100 | #166 | Average 98.0% |
| Immigrants | Spain | 54.6 /100 | #167 | Average 98.0% |
| Navajo | 54.4 /100 | #168 | Average 98.0% |
| Immigrants | Korea | 54.1 /100 | #169 | Average 98.0% |
| Bermudans | 54.0 /100 | #170 | Average 98.0% |
| Immigrants | Jordan | 54.0 /100 | #171 | Average 98.0% |
| Natives/Alaskans | 51.0 /100 | #172 | Average 98.0% |
| Kenyans | 51.0 /100 | #173 | Average 98.0% |
| Immigrants | Brazil | 50.0 /100 | #174 | Average 98.0% |
| Immigrants | Sri Lanka | 49.6 /100 | #175 | Average 97.9% |
Demographics Similar to Nonimmigrants by Kindergarten
In terms of kindergarten, the demographic groups most similar to Nonimmigrants are Cypriot (98.3%, a difference of 0.0%), Choctaw (98.3%, a difference of 0.0%), Colville (98.3%, a difference of 0.0%), South African (98.3%, a difference of 0.010%), and Immigrants from Germany (98.3%, a difference of 0.010%).
| Demographics | Rating | Rank | Kindergarten |
| Immigrants | South Africa | 98.8 /100 | #89 | Exceptional 98.3% |
| Zimbabweans | 98.8 /100 | #90 | Exceptional 98.3% |
| Immigrants | Western Europe | 98.8 /100 | #91 | Exceptional 98.3% |
| Macedonians | 98.7 /100 | #92 | Exceptional 98.3% |
| Immigrants | India | 98.6 /100 | #93 | Exceptional 98.3% |
| South Africans | 98.5 /100 | #94 | Exceptional 98.3% |
| Immigrants | Germany | 98.5 /100 | #95 | Exceptional 98.3% |
| Immigrants | Nonimmigrants | 98.3 /100 | #96 | Exceptional 98.3% |
| Cypriots | 98.3 /100 | #97 | Exceptional 98.3% |
| Choctaw | 98.2 /100 | #98 | Exceptional 98.3% |
| Colville | 98.2 /100 | #99 | Exceptional 98.3% |
| Puget Sound Salish | 98.1 /100 | #100 | Exceptional 98.2% |
| Romanians | 97.8 /100 | #101 | Exceptional 98.2% |
| Cree | 97.7 /100 | #102 | Exceptional 98.2% |
| Immigrants | Ireland | 97.6 /100 | #103 | Exceptional 98.2% |