Navajo vs Immigrants from the Azores 5th Grade
COMPARE
Navajo
Immigrants from the Azores
5th Grade
5th Grade Comparison
Navajo
Immigrants from the Azores
97.2%
5TH GRADE
29.0/ 100
METRIC RATING
193rd/ 347
METRIC RANK
95.1%
5TH GRADE
0.0/ 100
METRIC RATING
336th/ 347
METRIC RANK
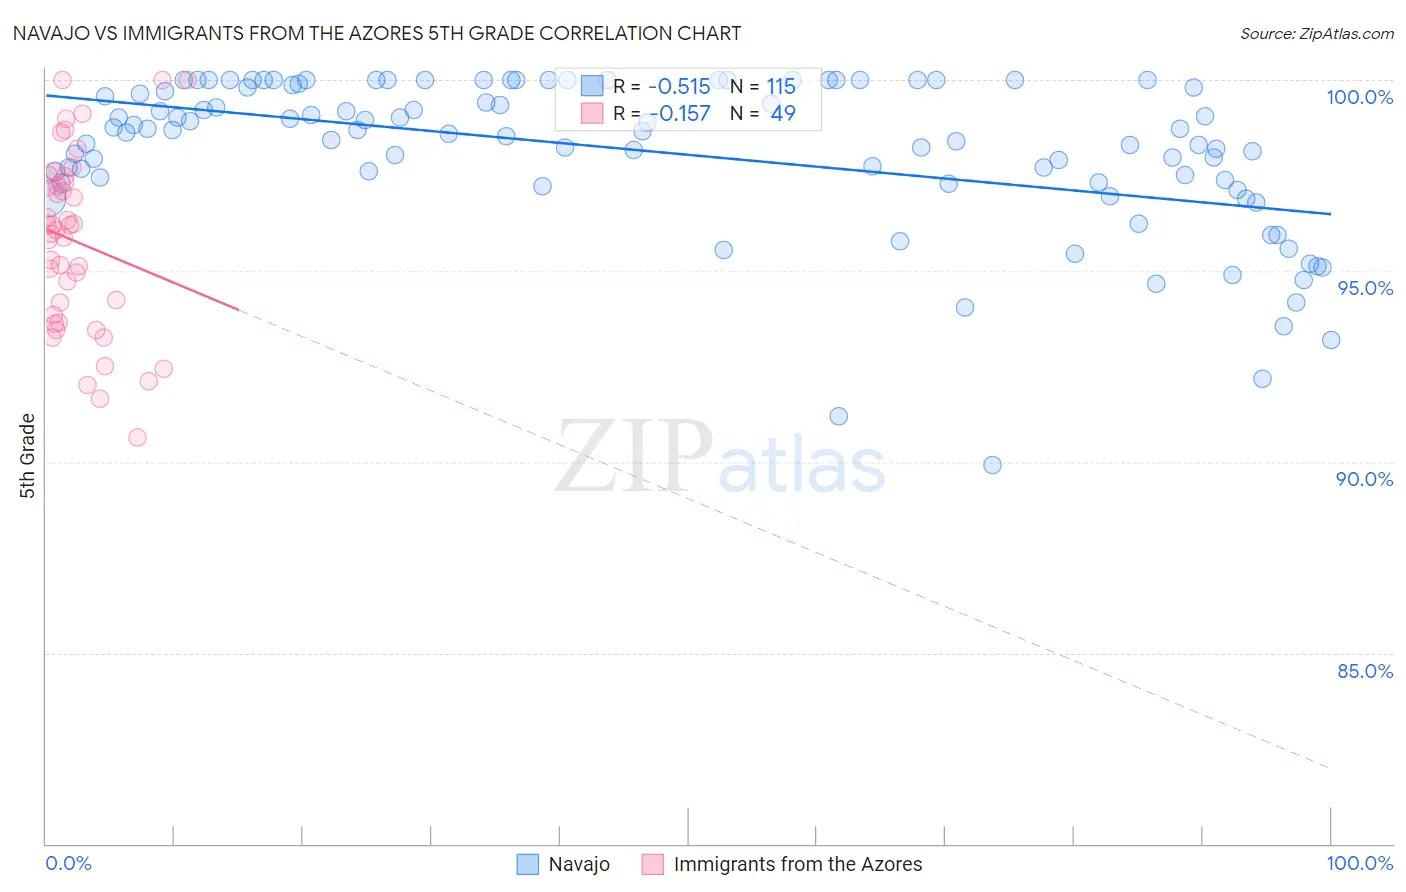
Navajo vs Immigrants from the Azores 5th Grade Correlation Chart
The statistical analysis conducted on geographies consisting of 224,872,927 people shows a substantial negative correlation between the proportion of Navajo and percentage of population with at least 5th grade education in the United States with a correlation coefficient (R) of -0.515 and weighted average of 97.2%. Similarly, the statistical analysis conducted on geographies consisting of 46,257,310 people shows a poor negative correlation between the proportion of Immigrants from the Azores and percentage of population with at least 5th grade education in the United States with a correlation coefficient (R) of -0.157 and weighted average of 95.1%, a difference of 2.2%.
5th Grade Correlation Summary
| Measurement | Navajo | Immigrants from the Azores |
| Minimum | 89.9% | 90.6% |
| Maximum | 100.0% | 100.0% |
| Range | 10.1% | 9.4% |
| Mean | 98.1% | 95.8% |
| Median | 98.7% | 96.1% |
| Interquartile 25% (IQ1) | 97.3% | 93.8% |
| Interquartile 75% (IQ3) | 99.9% | 97.4% |
| Interquartile Range (IQR) | 2.6% | 3.6% |
| Standard Deviation (Sample) | 2.0% | 2.3% |
| Standard Deviation (Population) | 2.0% | 2.3% |
Similar Demographics by 5th Grade
Demographics Similar to Navajo by 5th Grade
In terms of 5th grade, the demographic groups most similar to Navajo are Immigrants from Albania (97.2%, a difference of 0.0%), Black/African American (97.3%, a difference of 0.010%), Immigrants from Brazil (97.3%, a difference of 0.010%), Panamanian (97.3%, a difference of 0.010%), and Guamanian/Chamorro (97.2%, a difference of 0.010%).
| Demographics | Rating | Rank | 5th Grade |
| Immigrants | Argentina | 36.1 /100 | #186 | Fair 97.3% |
| Spanish Americans | 34.7 /100 | #187 | Fair 97.3% |
| Paraguayans | 33.7 /100 | #188 | Fair 97.3% |
| Immigrants | Egypt | 32.9 /100 | #189 | Fair 97.3% |
| Blacks/African Americans | 31.8 /100 | #190 | Fair 97.3% |
| Immigrants | Brazil | 31.5 /100 | #191 | Fair 97.3% |
| Panamanians | 31.3 /100 | #192 | Fair 97.3% |
| Navajo | 29.0 /100 | #193 | Fair 97.2% |
| Immigrants | Albania | 28.5 /100 | #194 | Fair 97.2% |
| Guamanians/Chamorros | 26.8 /100 | #195 | Fair 97.2% |
| Hawaiians | 25.6 /100 | #196 | Fair 97.2% |
| Brazilians | 25.4 /100 | #197 | Fair 97.2% |
| Immigrants | Uganda | 21.1 /100 | #198 | Fair 97.2% |
| Natives/Alaskans | 18.0 /100 | #199 | Poor 97.2% |
| Immigrants | Northern Africa | 16.8 /100 | #200 | Poor 97.2% |
Demographics Similar to Immigrants from the Azores by 5th Grade
In terms of 5th grade, the demographic groups most similar to Immigrants from the Azores are Central American (95.1%, a difference of 0.070%), Mexican (95.2%, a difference of 0.10%), Nepalese (95.2%, a difference of 0.13%), Immigrants from Dominican Republic (95.3%, a difference of 0.16%), and Immigrants from Latin America (95.3%, a difference of 0.16%).
| Demographics | Rating | Rank | 5th Grade |
| Mexican American Indians | 0.0 /100 | #329 | Tragic 95.5% |
| Immigrants | Armenia | 0.0 /100 | #330 | Tragic 95.4% |
| Immigrants | Honduras | 0.0 /100 | #331 | Tragic 95.4% |
| Immigrants | Dominican Republic | 0.0 /100 | #332 | Tragic 95.3% |
| Immigrants | Latin America | 0.0 /100 | #333 | Tragic 95.3% |
| Nepalese | 0.0 /100 | #334 | Tragic 95.2% |
| Mexicans | 0.0 /100 | #335 | Tragic 95.2% |
| Immigrants | Azores | 0.0 /100 | #336 | Tragic 95.1% |
| Central Americans | 0.0 /100 | #337 | Tragic 95.1% |
| Immigrants | Cabo Verde | 0.0 /100 | #338 | Tragic 94.9% |
| Immigrants | Yemen | 0.0 /100 | #339 | Tragic 94.9% |
| Guatemalans | 0.0 /100 | #340 | Tragic 94.8% |
| Yakama | 0.0 /100 | #341 | Tragic 94.8% |
| Immigrants | Central America | 0.0 /100 | #342 | Tragic 94.7% |
| Salvadorans | 0.0 /100 | #343 | Tragic 94.6% |