Cheyenne vs Immigrants from the Azores 5th Grade
COMPARE
Cheyenne
Immigrants from the Azores
5th Grade
5th Grade Comparison
Cheyenne
Immigrants from the Azores
97.7%
5TH GRADE
97.9/ 100
METRIC RATING
103rd/ 347
METRIC RANK
95.1%
5TH GRADE
0.0/ 100
METRIC RATING
336th/ 347
METRIC RANK
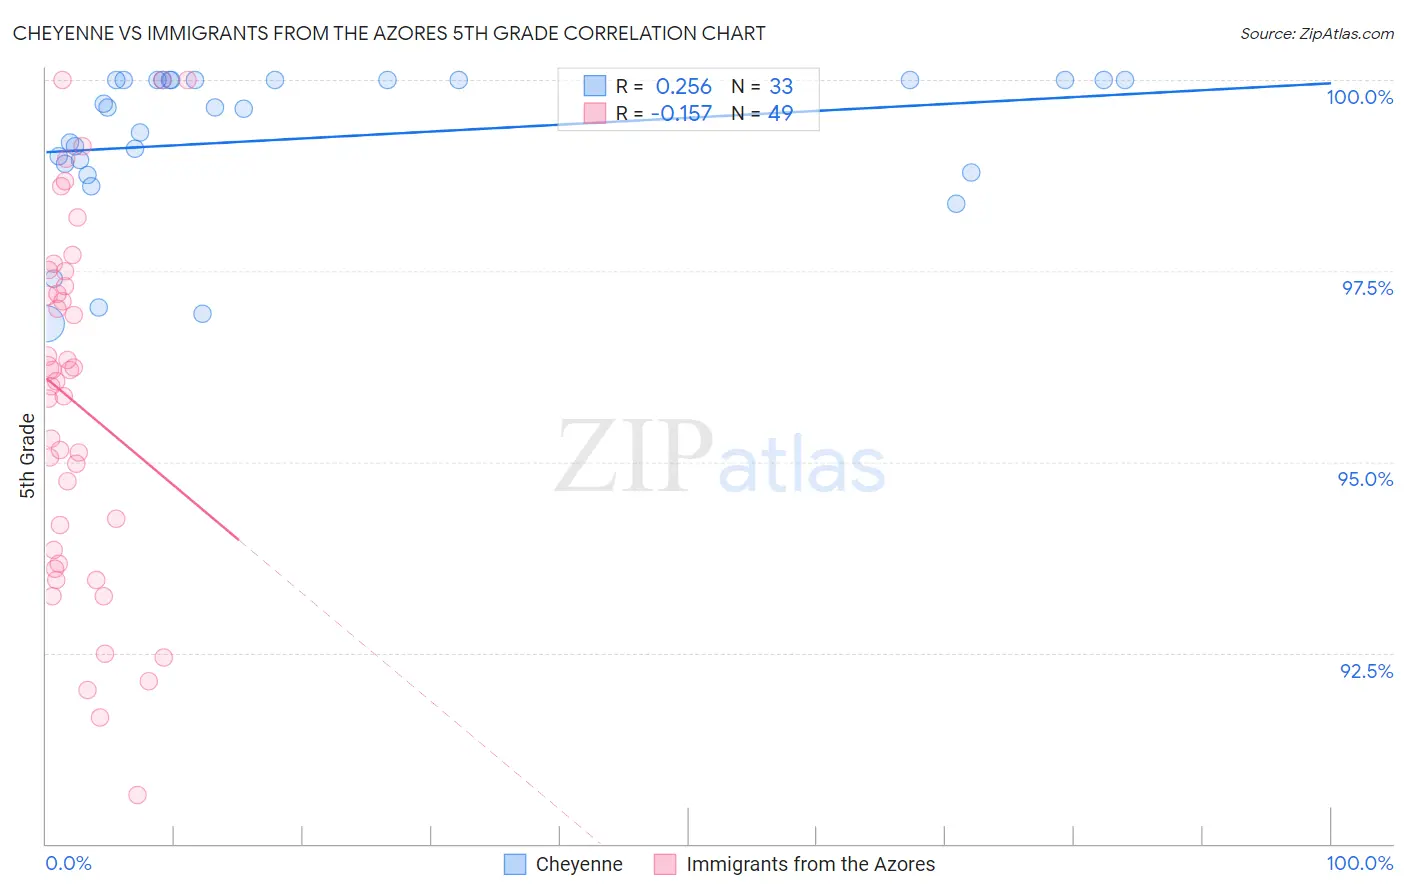
Cheyenne vs Immigrants from the Azores 5th Grade Correlation Chart
The statistical analysis conducted on geographies consisting of 80,716,760 people shows a weak positive correlation between the proportion of Cheyenne and percentage of population with at least 5th grade education in the United States with a correlation coefficient (R) of 0.256 and weighted average of 97.7%. Similarly, the statistical analysis conducted on geographies consisting of 46,257,310 people shows a poor negative correlation between the proportion of Immigrants from the Azores and percentage of population with at least 5th grade education in the United States with a correlation coefficient (R) of -0.157 and weighted average of 95.1%, a difference of 2.7%.
5th Grade Correlation Summary
| Measurement | Cheyenne | Immigrants from the Azores |
| Minimum | 96.8% | 90.6% |
| Maximum | 100.0% | 100.0% |
| Range | 3.2% | 9.4% |
| Mean | 99.2% | 95.8% |
| Median | 99.6% | 96.1% |
| Interquartile 25% (IQ1) | 98.8% | 93.8% |
| Interquartile 75% (IQ3) | 100.0% | 97.4% |
| Interquartile Range (IQR) | 1.2% | 3.6% |
| Standard Deviation (Sample) | 0.97% | 2.3% |
| Standard Deviation (Population) | 0.95% | 2.3% |
Similar Demographics by 5th Grade
Demographics Similar to Cheyenne by 5th Grade
In terms of 5th grade, the demographic groups most similar to Cheyenne are Choctaw (97.7%, a difference of 0.0%), German Russian (97.7%, a difference of 0.010%), Yugoslavian (97.7%, a difference of 0.020%), Turkish (97.7%, a difference of 0.020%), and Puget Sound Salish (97.7%, a difference of 0.020%).
| Demographics | Rating | Rank | 5th Grade |
| Immigrants | Germany | 98.5 /100 | #96 | Exceptional 97.8% |
| Cree | 98.4 /100 | #97 | Exceptional 97.7% |
| Yugoslavians | 98.3 /100 | #98 | Exceptional 97.7% |
| Turks | 98.3 /100 | #99 | Exceptional 97.7% |
| Puget Sound Salish | 98.3 /100 | #100 | Exceptional 97.7% |
| South Africans | 98.3 /100 | #101 | Exceptional 97.7% |
| Choctaw | 98.0 /100 | #102 | Exceptional 97.7% |
| Cheyenne | 97.9 /100 | #103 | Exceptional 97.7% |
| German Russians | 97.8 /100 | #104 | Exceptional 97.7% |
| Bhutanese | 97.6 /100 | #105 | Exceptional 97.7% |
| Immigrants | Czechoslovakia | 97.5 /100 | #106 | Exceptional 97.7% |
| Immigrants | Singapore | 97.5 /100 | #107 | Exceptional 97.7% |
| Immigrants | Nonimmigrants | 97.3 /100 | #108 | Exceptional 97.7% |
| Immigrants | Latvia | 97.1 /100 | #109 | Exceptional 97.7% |
| Thais | 96.9 /100 | #110 | Exceptional 97.7% |
Demographics Similar to Immigrants from the Azores by 5th Grade
In terms of 5th grade, the demographic groups most similar to Immigrants from the Azores are Central American (95.1%, a difference of 0.070%), Mexican (95.2%, a difference of 0.10%), Nepalese (95.2%, a difference of 0.13%), Immigrants from Dominican Republic (95.3%, a difference of 0.16%), and Immigrants from Latin America (95.3%, a difference of 0.16%).
| Demographics | Rating | Rank | 5th Grade |
| Mexican American Indians | 0.0 /100 | #329 | Tragic 95.5% |
| Immigrants | Armenia | 0.0 /100 | #330 | Tragic 95.4% |
| Immigrants | Honduras | 0.0 /100 | #331 | Tragic 95.4% |
| Immigrants | Dominican Republic | 0.0 /100 | #332 | Tragic 95.3% |
| Immigrants | Latin America | 0.0 /100 | #333 | Tragic 95.3% |
| Nepalese | 0.0 /100 | #334 | Tragic 95.2% |
| Mexicans | 0.0 /100 | #335 | Tragic 95.2% |
| Immigrants | Azores | 0.0 /100 | #336 | Tragic 95.1% |
| Central Americans | 0.0 /100 | #337 | Tragic 95.1% |
| Immigrants | Cabo Verde | 0.0 /100 | #338 | Tragic 94.9% |
| Immigrants | Yemen | 0.0 /100 | #339 | Tragic 94.9% |
| Guatemalans | 0.0 /100 | #340 | Tragic 94.8% |
| Yakama | 0.0 /100 | #341 | Tragic 94.8% |
| Immigrants | Central America | 0.0 /100 | #342 | Tragic 94.7% |
| Salvadorans | 0.0 /100 | #343 | Tragic 94.6% |