Moroccan vs Turkish High School Diploma
COMPARE
Moroccan
Turkish
High School Diploma
High School Diploma Comparison
Moroccans
Turks
88.8%
HIGH SCHOOL DIPLOMA
29.5/ 100
METRIC RATING
192nd/ 347
METRIC RANK
91.2%
HIGH SCHOOL DIPLOMA
99.8/ 100
METRIC RATING
45th/ 347
METRIC RANK
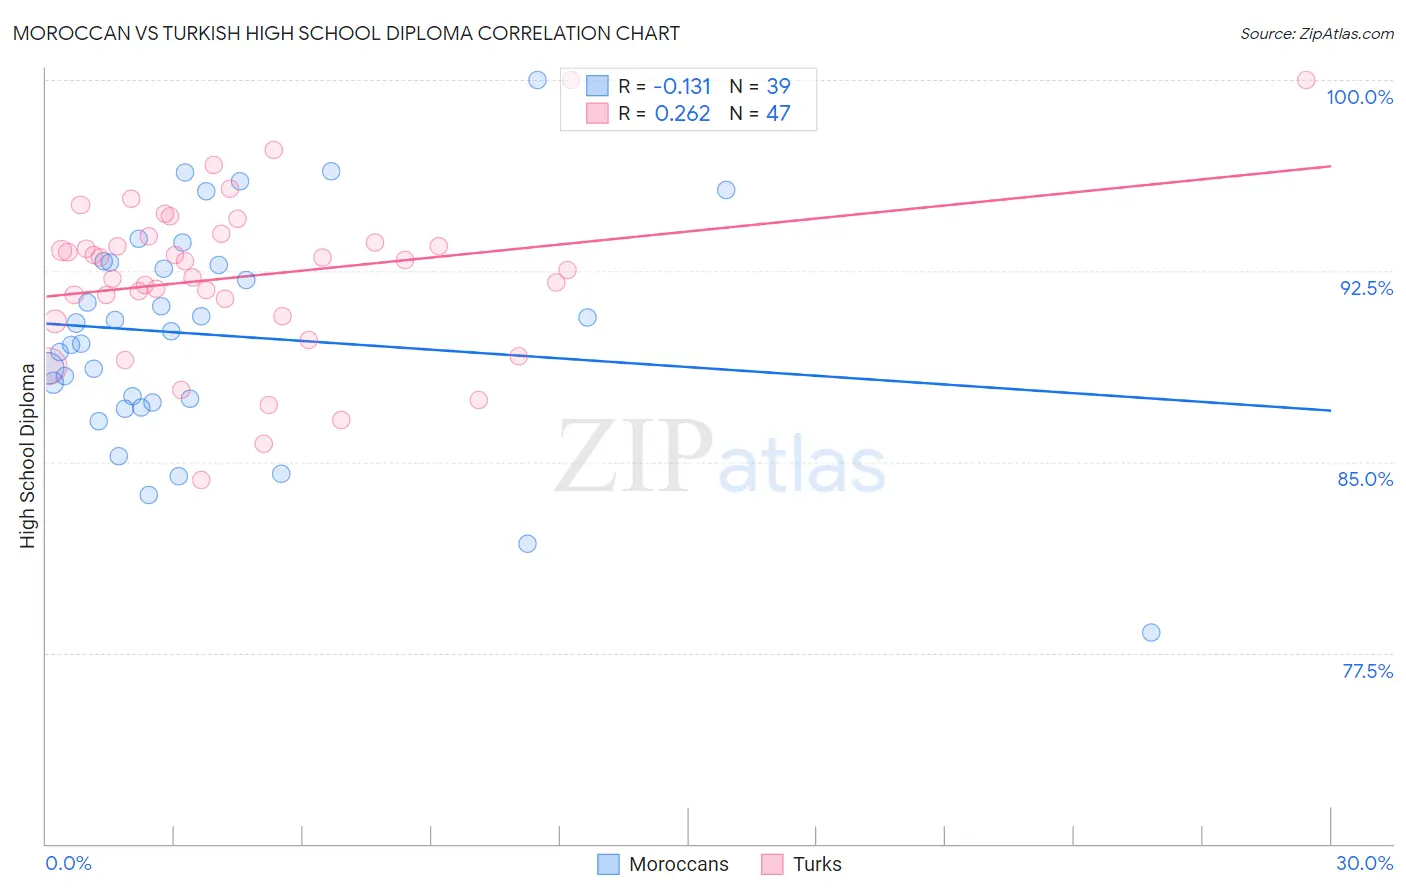
Moroccan vs Turkish High School Diploma Correlation Chart
The statistical analysis conducted on geographies consisting of 201,817,667 people shows a poor negative correlation between the proportion of Moroccans and percentage of population with at least high school diploma education in the United States with a correlation coefficient (R) of -0.131 and weighted average of 88.8%. Similarly, the statistical analysis conducted on geographies consisting of 271,864,133 people shows a weak positive correlation between the proportion of Turks and percentage of population with at least high school diploma education in the United States with a correlation coefficient (R) of 0.262 and weighted average of 91.2%, a difference of 2.7%.
High School Diploma Correlation Summary
| Measurement | Moroccan | Turkish |
| Minimum | 78.3% | 84.3% |
| Maximum | 100.0% | 100.0% |
| Range | 21.7% | 15.7% |
| Mean | 90.0% | 92.3% |
| Median | 90.1% | 92.9% |
| Interquartile 25% (IQ1) | 87.3% | 90.7% |
| Interquartile 75% (IQ3) | 92.9% | 93.8% |
| Interquartile Range (IQR) | 5.5% | 3.1% |
| Standard Deviation (Sample) | 4.4% | 3.2% |
| Standard Deviation (Population) | 4.3% | 3.2% |
Similar Demographics by High School Diploma
Demographics Similar to Moroccans by High School Diploma
In terms of high school diploma, the demographic groups most similar to Moroccans are Immigrants from Ethiopia (88.9%, a difference of 0.020%), Immigrants from Chile (88.9%, a difference of 0.040%), Immigrants from Uganda (88.9%, a difference of 0.050%), Immigrants from Oceania (88.8%, a difference of 0.050%), and Immigrants from Sudan (88.9%, a difference of 0.070%).
| Demographics | Rating | Rank | High School Diploma |
| Ethiopians | 37.0 /100 | #185 | Fair 89.0% |
| Immigrants | Eastern Africa | 35.8 /100 | #186 | Fair 88.9% |
| Guamanians/Chamorros | 35.5 /100 | #187 | Fair 88.9% |
| Immigrants | Sudan | 33.4 /100 | #188 | Fair 88.9% |
| Immigrants | Uganda | 32.6 /100 | #189 | Fair 88.9% |
| Immigrants | Chile | 31.9 /100 | #190 | Fair 88.9% |
| Immigrants | Ethiopia | 30.9 /100 | #191 | Fair 88.9% |
| Moroccans | 29.5 /100 | #192 | Fair 88.8% |
| Immigrants | Oceania | 26.9 /100 | #193 | Fair 88.8% |
| Immigrants | Venezuela | 25.8 /100 | #194 | Fair 88.8% |
| Afghans | 23.9 /100 | #195 | Fair 88.8% |
| Immigrants | Southern Europe | 23.4 /100 | #196 | Fair 88.7% |
| French American Indians | 21.5 /100 | #197 | Fair 88.7% |
| Liberians | 18.8 /100 | #198 | Poor 88.7% |
| Marshallese | 18.7 /100 | #199 | Poor 88.6% |
Demographics Similar to Turks by High School Diploma
In terms of high school diploma, the demographic groups most similar to Turks are Immigrants from Austria (91.3%, a difference of 0.0%), Northern European (91.3%, a difference of 0.020%), British (91.3%, a difference of 0.020%), Immigrants from Australia (91.3%, a difference of 0.030%), and Greek (91.2%, a difference of 0.030%).
| Demographics | Rating | Rank | High School Diploma |
| Immigrants | Scotland | 99.8 /100 | #38 | Exceptional 91.3% |
| Dutch | 99.8 /100 | #39 | Exceptional 91.3% |
| Immigrants | Lithuania | 99.8 /100 | #40 | Exceptional 91.3% |
| Immigrants | Australia | 99.8 /100 | #41 | Exceptional 91.3% |
| Northern Europeans | 99.8 /100 | #42 | Exceptional 91.3% |
| British | 99.8 /100 | #43 | Exceptional 91.3% |
| Immigrants | Austria | 99.8 /100 | #44 | Exceptional 91.3% |
| Turks | 99.8 /100 | #45 | Exceptional 91.2% |
| Greeks | 99.8 /100 | #46 | Exceptional 91.2% |
| Australians | 99.8 /100 | #47 | Exceptional 91.2% |
| Belgians | 99.8 /100 | #48 | Exceptional 91.2% |
| Bhutanese | 99.8 /100 | #49 | Exceptional 91.2% |
| Welsh | 99.8 /100 | #50 | Exceptional 91.2% |
| New Zealanders | 99.7 /100 | #51 | Exceptional 91.1% |
| Immigrants | Sweden | 99.7 /100 | #52 | Exceptional 91.1% |