Immigrants from Jamaica vs Turkish High School Diploma
COMPARE
Immigrants from Jamaica
Turkish
High School Diploma
High School Diploma Comparison
Immigrants from Jamaica
Turks
86.9%
HIGH SCHOOL DIPLOMA
0.1/ 100
METRIC RATING
273rd/ 347
METRIC RANK
91.2%
HIGH SCHOOL DIPLOMA
99.8/ 100
METRIC RATING
45th/ 347
METRIC RANK
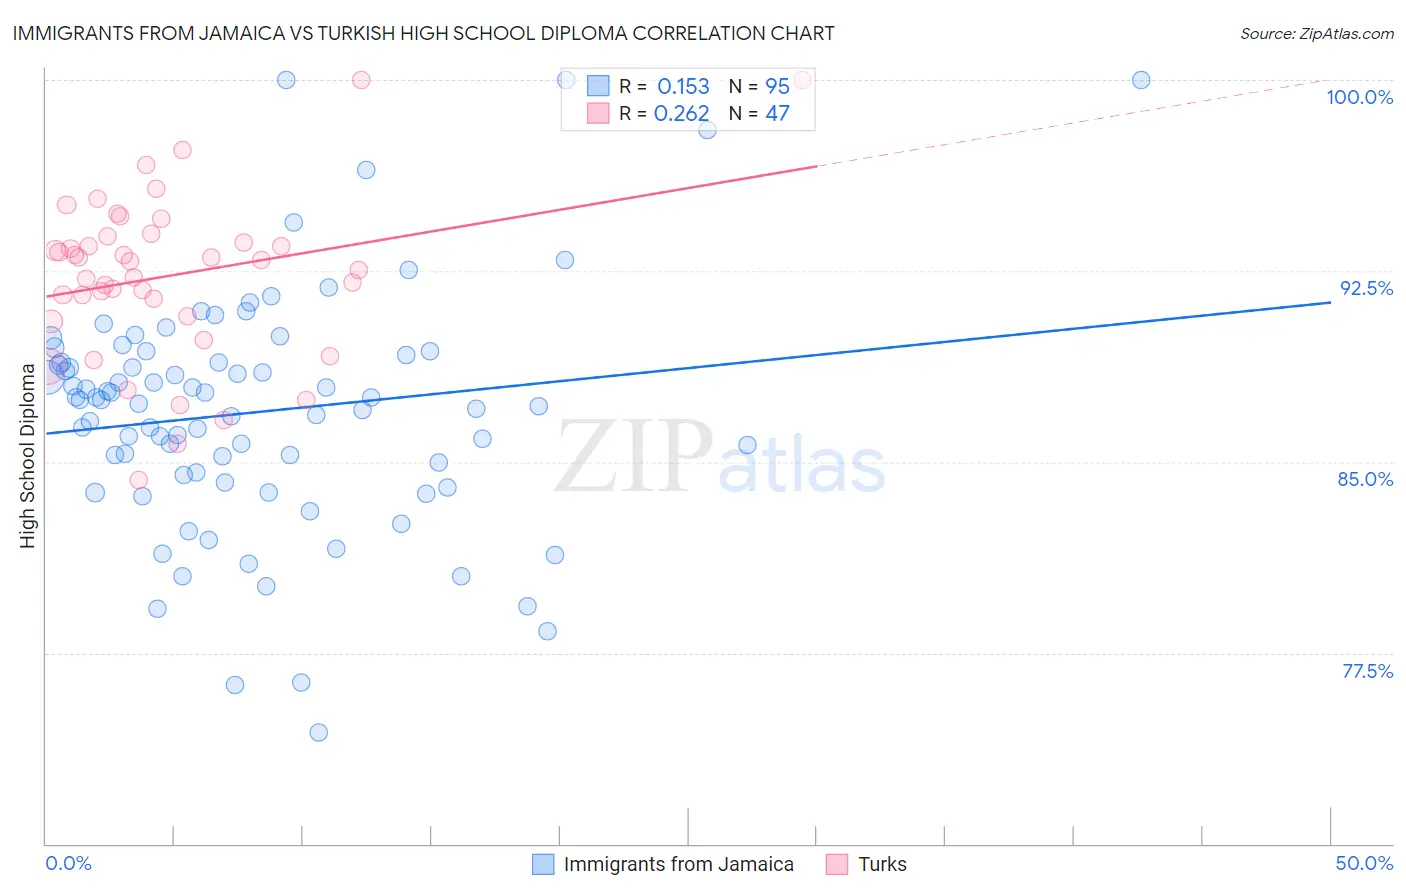
Immigrants from Jamaica vs Turkish High School Diploma Correlation Chart
The statistical analysis conducted on geographies consisting of 301,829,550 people shows a poor positive correlation between the proportion of Immigrants from Jamaica and percentage of population with at least high school diploma education in the United States with a correlation coefficient (R) of 0.153 and weighted average of 86.9%. Similarly, the statistical analysis conducted on geographies consisting of 271,864,133 people shows a weak positive correlation between the proportion of Turks and percentage of population with at least high school diploma education in the United States with a correlation coefficient (R) of 0.262 and weighted average of 91.2%, a difference of 5.0%.
High School Diploma Correlation Summary
| Measurement | Immigrants from Jamaica | Turkish |
| Minimum | 74.4% | 84.3% |
| Maximum | 100.0% | 100.0% |
| Range | 25.6% | 15.7% |
| Mean | 87.0% | 92.3% |
| Median | 87.4% | 92.9% |
| Interquartile 25% (IQ1) | 84.5% | 90.7% |
| Interquartile 75% (IQ3) | 89.2% | 93.8% |
| Interquartile Range (IQR) | 4.7% | 3.1% |
| Standard Deviation (Sample) | 4.7% | 3.2% |
| Standard Deviation (Population) | 4.7% | 3.2% |
Similar Demographics by High School Diploma
Demographics Similar to Immigrants from Jamaica by High School Diploma
In terms of high school diploma, the demographic groups most similar to Immigrants from Jamaica are Bangladeshi (86.9%, a difference of 0.010%), Trinidadian and Tobagonian (86.9%, a difference of 0.030%), West Indian (86.9%, a difference of 0.040%), Malaysian (87.0%, a difference of 0.11%), and Sri Lankan (87.0%, a difference of 0.12%).
| Demographics | Rating | Rank | High School Diploma |
| Immigrants | Congo | 0.2 /100 | #266 | Tragic 87.0% |
| Blacks/African Americans | 0.2 /100 | #267 | Tragic 87.0% |
| Pennsylvania Germans | 0.2 /100 | #268 | Tragic 87.0% |
| Sri Lankans | 0.2 /100 | #269 | Tragic 87.0% |
| Malaysians | 0.2 /100 | #270 | Tragic 87.0% |
| West Indians | 0.1 /100 | #271 | Tragic 86.9% |
| Trinidadians and Tobagonians | 0.1 /100 | #272 | Tragic 86.9% |
| Immigrants | Jamaica | 0.1 /100 | #273 | Tragic 86.9% |
| Bangladeshis | 0.1 /100 | #274 | Tragic 86.9% |
| Immigrants | Trinidad and Tobago | 0.1 /100 | #275 | Tragic 86.8% |
| Immigrants | Burma/Myanmar | 0.1 /100 | #276 | Tragic 86.7% |
| Barbadians | 0.1 /100 | #277 | Tragic 86.7% |
| Hopi | 0.1 /100 | #278 | Tragic 86.6% |
| Immigrants | Laos | 0.0 /100 | #279 | Tragic 86.6% |
| Pueblo | 0.0 /100 | #280 | Tragic 86.5% |
Demographics Similar to Turks by High School Diploma
In terms of high school diploma, the demographic groups most similar to Turks are Immigrants from Austria (91.3%, a difference of 0.0%), Northern European (91.3%, a difference of 0.020%), British (91.3%, a difference of 0.020%), Immigrants from Australia (91.3%, a difference of 0.030%), and Greek (91.2%, a difference of 0.030%).
| Demographics | Rating | Rank | High School Diploma |
| Immigrants | Scotland | 99.8 /100 | #38 | Exceptional 91.3% |
| Dutch | 99.8 /100 | #39 | Exceptional 91.3% |
| Immigrants | Lithuania | 99.8 /100 | #40 | Exceptional 91.3% |
| Immigrants | Australia | 99.8 /100 | #41 | Exceptional 91.3% |
| Northern Europeans | 99.8 /100 | #42 | Exceptional 91.3% |
| British | 99.8 /100 | #43 | Exceptional 91.3% |
| Immigrants | Austria | 99.8 /100 | #44 | Exceptional 91.3% |
| Turks | 99.8 /100 | #45 | Exceptional 91.2% |
| Greeks | 99.8 /100 | #46 | Exceptional 91.2% |
| Australians | 99.8 /100 | #47 | Exceptional 91.2% |
| Belgians | 99.8 /100 | #48 | Exceptional 91.2% |
| Bhutanese | 99.8 /100 | #49 | Exceptional 91.2% |
| Welsh | 99.8 /100 | #50 | Exceptional 91.2% |
| New Zealanders | 99.7 /100 | #51 | Exceptional 91.1% |
| Immigrants | Sweden | 99.7 /100 | #52 | Exceptional 91.1% |