Marshallese vs Yakama Nursery School
COMPARE
Marshallese
Yakama
Nursery School
Nursery School Comparison
Marshallese
Yakama
98.1%
NURSERY SCHOOL
81.2/ 100
METRIC RATING
143rd/ 347
METRIC RANK
96.6%
NURSERY SCHOOL
0.0/ 100
METRIC RATING
332nd/ 347
METRIC RANK
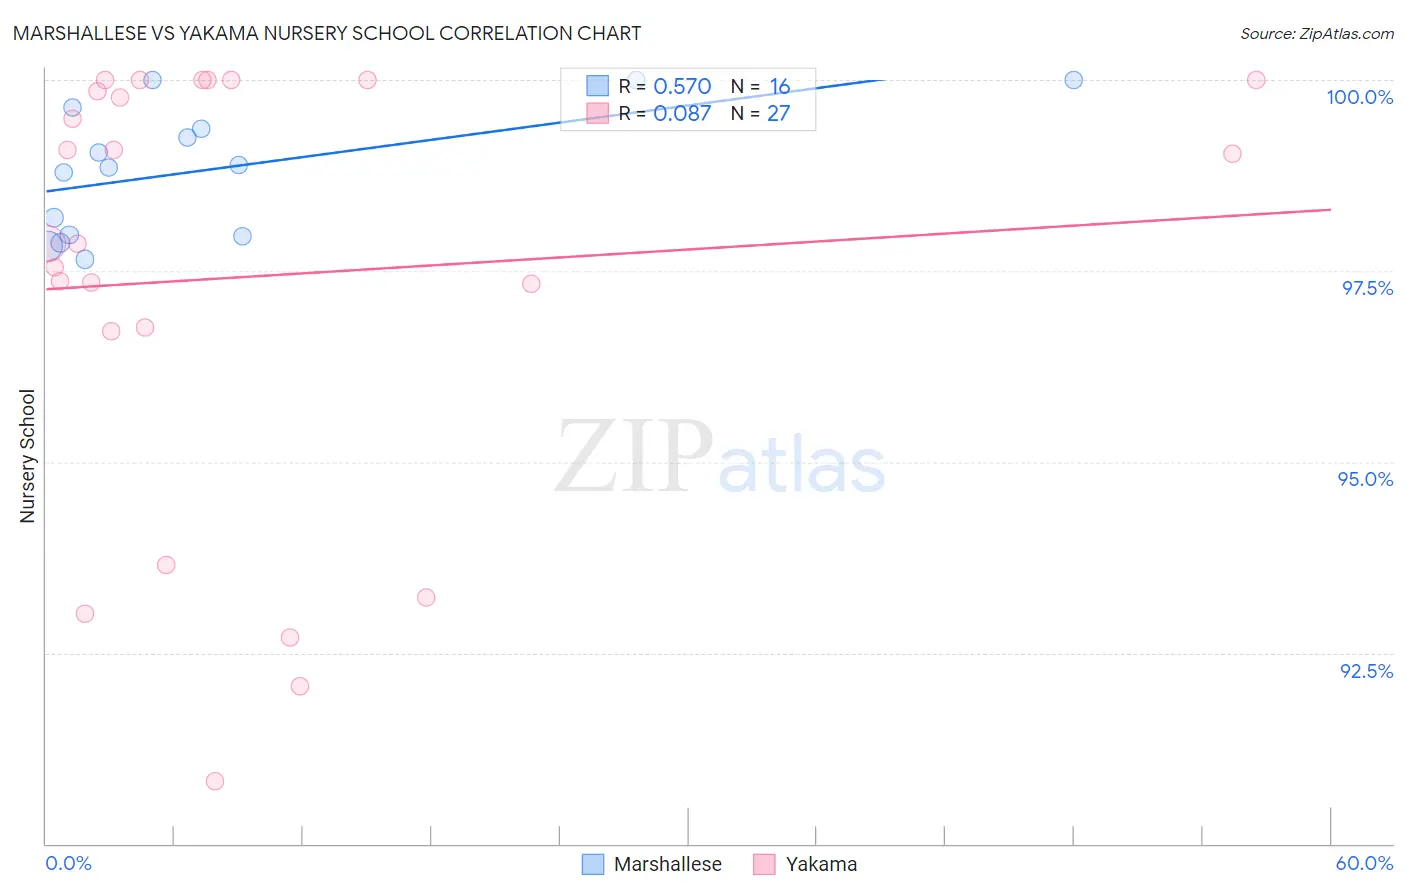
Marshallese vs Yakama Nursery School Correlation Chart
The statistical analysis conducted on geographies consisting of 14,761,315 people shows a substantial positive correlation between the proportion of Marshallese and percentage of population with at least nursery school education in the United States with a correlation coefficient (R) of 0.570 and weighted average of 98.1%. Similarly, the statistical analysis conducted on geographies consisting of 19,923,144 people shows a slight positive correlation between the proportion of Yakama and percentage of population with at least nursery school education in the United States with a correlation coefficient (R) of 0.087 and weighted average of 96.6%, a difference of 1.5%.
Nursery School Correlation Summary
| Measurement | Marshallese | Yakama |
| Minimum | 97.7% | 90.8% |
| Maximum | 100.0% | 100.0% |
| Range | 2.3% | 9.2% |
| Mean | 98.8% | 97.4% |
| Median | 98.9% | 97.9% |
| Interquartile 25% (IQ1) | 98.0% | 96.7% |
| Interquartile 75% (IQ3) | 99.5% | 100.0% |
| Interquartile Range (IQR) | 1.5% | 3.3% |
| Standard Deviation (Sample) | 0.84% | 2.9% |
| Standard Deviation (Population) | 0.81% | 2.8% |
Similar Demographics by Nursery School
Demographics Similar to Marshallese by Nursery School
In terms of nursery school, the demographic groups most similar to Marshallese are Burmese (98.1%, a difference of 0.0%), Alsatian (98.1%, a difference of 0.0%), Palestinian (98.1%, a difference of 0.010%), Immigrants from Turkey (98.1%, a difference of 0.010%), and Immigrants from Israel (98.1%, a difference of 0.010%).
| Demographics | Rating | Rank | Nursery School |
| Immigrants | Kuwait | 88.9 /100 | #136 | Excellent 98.1% |
| Israelis | 88.2 /100 | #137 | Excellent 98.1% |
| Immigrants | Romania | 88.0 /100 | #138 | Excellent 98.1% |
| Blackfeet | 87.5 /100 | #139 | Excellent 98.1% |
| Palestinians | 83.7 /100 | #140 | Excellent 98.1% |
| Immigrants | Turkey | 83.0 /100 | #141 | Excellent 98.1% |
| Burmese | 81.7 /100 | #142 | Excellent 98.1% |
| Marshallese | 81.2 /100 | #143 | Excellent 98.1% |
| Alsatians | 80.3 /100 | #144 | Excellent 98.1% |
| Immigrants | Israel | 78.5 /100 | #145 | Good 98.1% |
| Filipinos | 78.5 /100 | #146 | Good 98.1% |
| Hmong | 75.7 /100 | #147 | Good 98.1% |
| Immigrants | Greece | 75.4 /100 | #148 | Good 98.1% |
| Apache | 73.2 /100 | #149 | Good 98.1% |
| Jordanians | 72.9 /100 | #150 | Good 98.1% |
Demographics Similar to Yakama by Nursery School
In terms of nursery school, the demographic groups most similar to Yakama are Immigrants from Armenia (96.7%, a difference of 0.020%), Central American (96.6%, a difference of 0.020%), Immigrants from Dominican Republic (96.6%, a difference of 0.030%), Japanese (96.7%, a difference of 0.040%), and Immigrants from Vietnam (96.7%, a difference of 0.050%).
| Demographics | Rating | Rank | Nursery School |
| Dominicans | 0.0 /100 | #325 | Tragic 96.8% |
| Indonesians | 0.0 /100 | #326 | Tragic 96.8% |
| Mexicans | 0.0 /100 | #327 | Tragic 96.8% |
| Immigrants | Latin America | 0.0 /100 | #328 | Tragic 96.7% |
| Immigrants | Vietnam | 0.0 /100 | #329 | Tragic 96.7% |
| Japanese | 0.0 /100 | #330 | Tragic 96.7% |
| Immigrants | Armenia | 0.0 /100 | #331 | Tragic 96.7% |
| Yakama | 0.0 /100 | #332 | Tragic 96.6% |
| Central Americans | 0.0 /100 | #333 | Tragic 96.6% |
| Immigrants | Dominican Republic | 0.0 /100 | #334 | Tragic 96.6% |
| Bangladeshis | 0.0 /100 | #335 | Tragic 96.6% |
| Guatemalans | 0.0 /100 | #336 | Tragic 96.6% |
| Immigrants | Cambodia | 0.0 /100 | #337 | Tragic 96.5% |
| Immigrants | Fiji | 0.0 /100 | #338 | Tragic 96.5% |
| Immigrants | Guatemala | 0.0 /100 | #339 | Tragic 96.4% |