Marshallese vs Immigrants from El Salvador Nursery School
COMPARE
Marshallese
Immigrants from El Salvador
Nursery School
Nursery School Comparison
Marshallese
Immigrants from El Salvador
98.1%
NURSERY SCHOOL
81.2/ 100
METRIC RATING
143rd/ 347
METRIC RANK
96.2%
NURSERY SCHOOL
0.0/ 100
METRIC RATING
344th/ 347
METRIC RANK
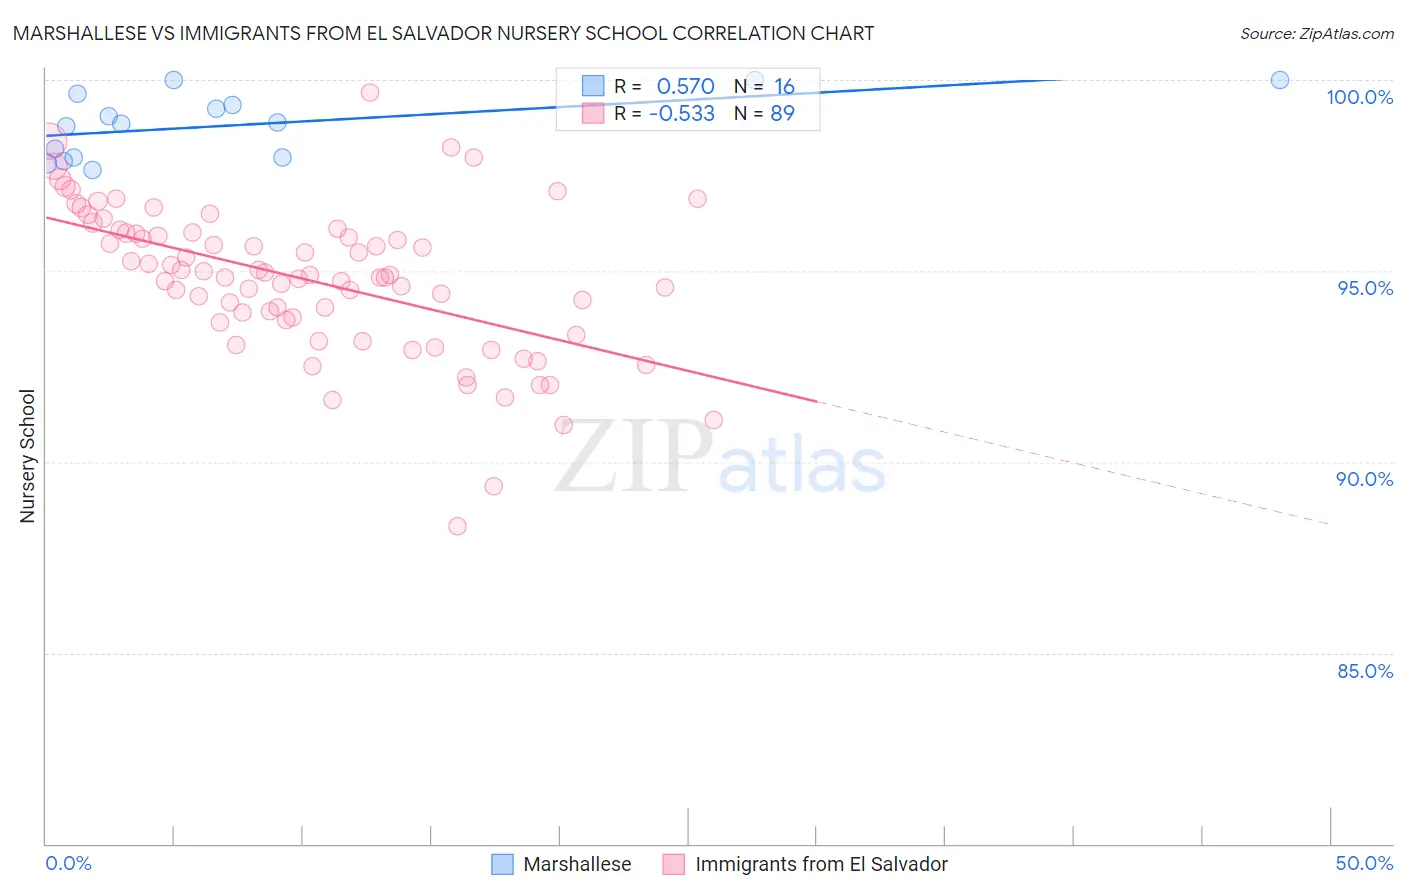
Marshallese vs Immigrants from El Salvador Nursery School Correlation Chart
The statistical analysis conducted on geographies consisting of 14,761,315 people shows a substantial positive correlation between the proportion of Marshallese and percentage of population with at least nursery school education in the United States with a correlation coefficient (R) of 0.570 and weighted average of 98.1%. Similarly, the statistical analysis conducted on geographies consisting of 357,698,489 people shows a substantial negative correlation between the proportion of Immigrants from El Salvador and percentage of population with at least nursery school education in the United States with a correlation coefficient (R) of -0.533 and weighted average of 96.2%, a difference of 1.9%.
Nursery School Correlation Summary
| Measurement | Marshallese | Immigrants from El Salvador |
| Minimum | 97.7% | 88.3% |
| Maximum | 100.0% | 99.7% |
| Range | 2.3% | 11.4% |
| Mean | 98.8% | 94.8% |
| Median | 98.9% | 94.9% |
| Interquartile 25% (IQ1) | 98.0% | 93.7% |
| Interquartile 75% (IQ3) | 99.5% | 96.0% |
| Interquartile Range (IQR) | 1.5% | 2.3% |
| Standard Deviation (Sample) | 0.84% | 2.0% |
| Standard Deviation (Population) | 0.81% | 2.0% |
Similar Demographics by Nursery School
Demographics Similar to Marshallese by Nursery School
In terms of nursery school, the demographic groups most similar to Marshallese are Burmese (98.1%, a difference of 0.0%), Alsatian (98.1%, a difference of 0.0%), Palestinian (98.1%, a difference of 0.010%), Immigrants from Turkey (98.1%, a difference of 0.010%), and Immigrants from Israel (98.1%, a difference of 0.010%).
| Demographics | Rating | Rank | Nursery School |
| Immigrants | Kuwait | 88.9 /100 | #136 | Excellent 98.1% |
| Israelis | 88.2 /100 | #137 | Excellent 98.1% |
| Immigrants | Romania | 88.0 /100 | #138 | Excellent 98.1% |
| Blackfeet | 87.5 /100 | #139 | Excellent 98.1% |
| Palestinians | 83.7 /100 | #140 | Excellent 98.1% |
| Immigrants | Turkey | 83.0 /100 | #141 | Excellent 98.1% |
| Burmese | 81.7 /100 | #142 | Excellent 98.1% |
| Marshallese | 81.2 /100 | #143 | Excellent 98.1% |
| Alsatians | 80.3 /100 | #144 | Excellent 98.1% |
| Immigrants | Israel | 78.5 /100 | #145 | Good 98.1% |
| Filipinos | 78.5 /100 | #146 | Good 98.1% |
| Hmong | 75.7 /100 | #147 | Good 98.1% |
| Immigrants | Greece | 75.4 /100 | #148 | Good 98.1% |
| Apache | 73.2 /100 | #149 | Good 98.1% |
| Jordanians | 72.9 /100 | #150 | Good 98.1% |
Demographics Similar to Immigrants from El Salvador by Nursery School
In terms of nursery school, the demographic groups most similar to Immigrants from El Salvador are Nepalese (96.2%, a difference of 0.010%), Salvadoran (96.4%, a difference of 0.15%), Immigrants from Mexico (96.4%, a difference of 0.18%), Immigrants from Cabo Verde (96.4%, a difference of 0.19%), and Immigrants from Central America (96.4%, a difference of 0.21%).
| Demographics | Rating | Rank | Nursery School |
| Central Americans | 0.0 /100 | #333 | Tragic 96.6% |
| Immigrants | Dominican Republic | 0.0 /100 | #334 | Tragic 96.6% |
| Bangladeshis | 0.0 /100 | #335 | Tragic 96.6% |
| Guatemalans | 0.0 /100 | #336 | Tragic 96.6% |
| Immigrants | Cambodia | 0.0 /100 | #337 | Tragic 96.5% |
| Immigrants | Fiji | 0.0 /100 | #338 | Tragic 96.5% |
| Immigrants | Guatemala | 0.0 /100 | #339 | Tragic 96.4% |
| Immigrants | Central America | 0.0 /100 | #340 | Tragic 96.4% |
| Immigrants | Cabo Verde | 0.0 /100 | #341 | Tragic 96.4% |
| Immigrants | Mexico | 0.0 /100 | #342 | Tragic 96.4% |
| Salvadorans | 0.0 /100 | #343 | Tragic 96.4% |
| Immigrants | El Salvador | 0.0 /100 | #344 | Tragic 96.2% |
| Nepalese | 0.0 /100 | #345 | Tragic 96.2% |
| Immigrants | Yemen | 0.0 /100 | #346 | Tragic 95.9% |
| Spanish American Indians | 0.0 /100 | #347 | Tragic 95.8% |