Luxembourger vs White/Caucasian College, 1 year or more
COMPARE
Luxembourger
White/Caucasian
College, 1 year or more
College, 1 year or more Comparison
Luxembourgers
Whites/Caucasians
62.1%
COLLEGE, 1 YEAR OR MORE
96.7/ 100
METRIC RATING
102nd/ 347
METRIC RANK
57.6%
COLLEGE, 1 YEAR OR MORE
8.7/ 100
METRIC RATING
219th/ 347
METRIC RANK
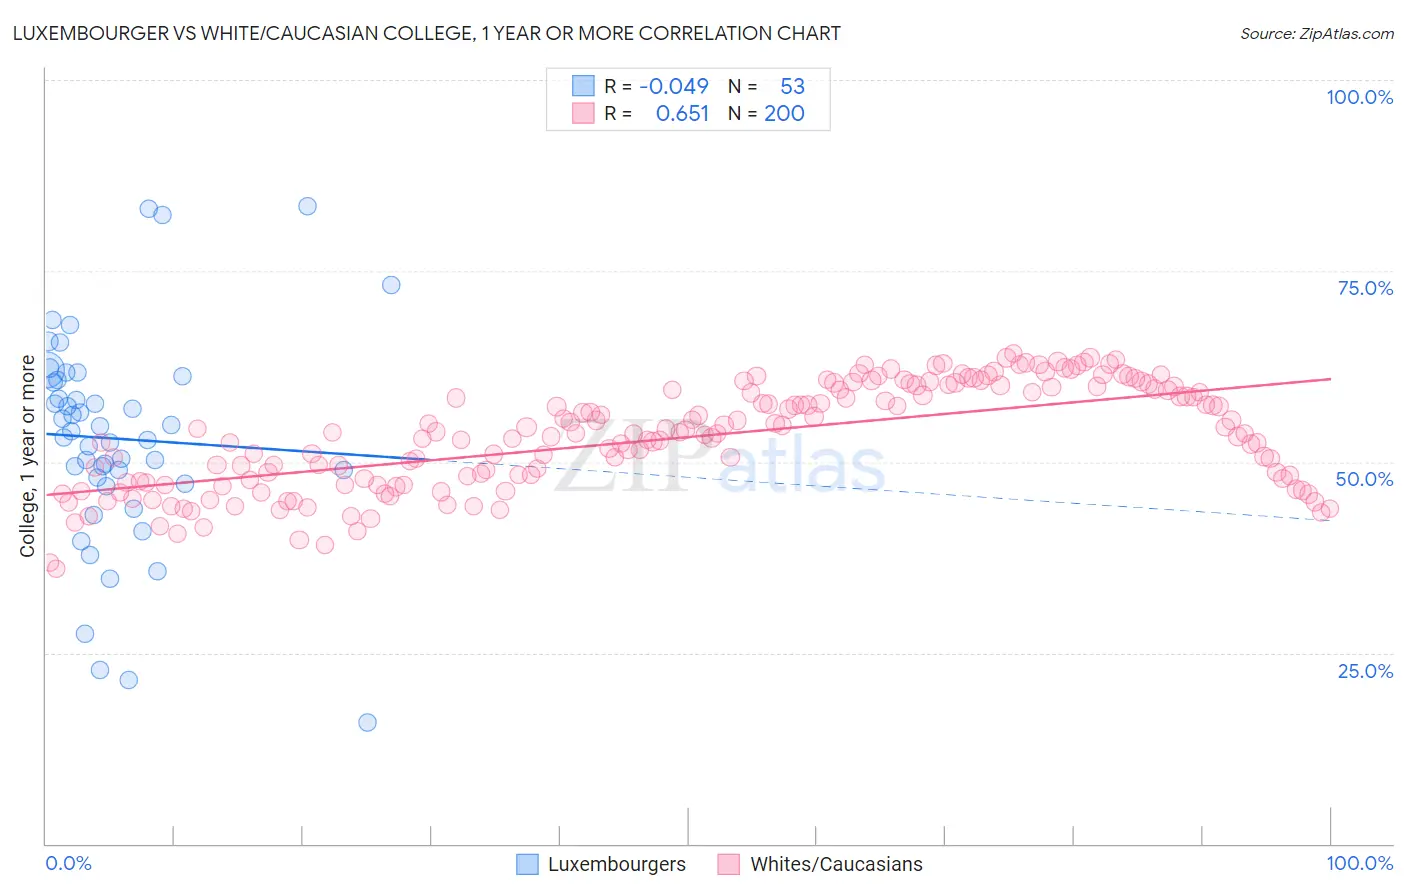
Luxembourger vs White/Caucasian College, 1 year or more Correlation Chart
The statistical analysis conducted on geographies consisting of 144,676,190 people shows no correlation between the proportion of Luxembourgers and percentage of population with at least college, 1 year or more education in the United States with a correlation coefficient (R) of -0.049 and weighted average of 62.1%. Similarly, the statistical analysis conducted on geographies consisting of 585,171,968 people shows a significant positive correlation between the proportion of Whites/Caucasians and percentage of population with at least college, 1 year or more education in the United States with a correlation coefficient (R) of 0.651 and weighted average of 57.6%, a difference of 7.9%.
College, 1 year or more Correlation Summary
| Measurement | Luxembourger | White/Caucasian |
| Minimum | 15.8% | 36.1% |
| Maximum | 83.5% | 64.2% |
| Range | 67.6% | 28.2% |
| Mean | 53.0% | 53.2% |
| Median | 54.1% | 53.7% |
| Interquartile 25% (IQ1) | 47.5% | 47.4% |
| Interquartile 75% (IQ3) | 61.0% | 59.5% |
| Interquartile Range (IQR) | 13.4% | 12.1% |
| Standard Deviation (Sample) | 13.9% | 6.7% |
| Standard Deviation (Population) | 13.8% | 6.7% |
Similar Demographics by College, 1 year or more
Demographics Similar to Luxembourgers by College, 1 year or more
In terms of college, 1 year or more, the demographic groups most similar to Luxembourgers are Icelander (62.1%, a difference of 0.020%), Swedish (62.1%, a difference of 0.020%), Afghan (62.0%, a difference of 0.12%), Chilean (62.0%, a difference of 0.13%), and Immigrants from Nepal (62.0%, a difference of 0.15%).
| Demographics | Rating | Rank | College, 1 year or more |
| British | 97.4 /100 | #95 | Exceptional 62.3% |
| Chinese | 97.2 /100 | #96 | Exceptional 62.2% |
| Jordanians | 97.2 /100 | #97 | Exceptional 62.2% |
| Carpatho Rusyns | 97.2 /100 | #98 | Exceptional 62.2% |
| Croatians | 97.1 /100 | #99 | Exceptional 62.2% |
| Icelanders | 96.8 /100 | #100 | Exceptional 62.1% |
| Swedes | 96.8 /100 | #101 | Exceptional 62.1% |
| Luxembourgers | 96.7 /100 | #102 | Exceptional 62.1% |
| Afghans | 96.4 /100 | #103 | Exceptional 62.0% |
| Chileans | 96.4 /100 | #104 | Exceptional 62.0% |
| Immigrants | Nepal | 96.3 /100 | #105 | Exceptional 62.0% |
| Palestinians | 96.3 /100 | #106 | Exceptional 62.0% |
| Immigrants | Ukraine | 95.8 /100 | #107 | Exceptional 61.9% |
| Syrians | 95.7 /100 | #108 | Exceptional 61.9% |
| Immigrants | Northern Africa | 95.7 /100 | #109 | Exceptional 61.9% |
Demographics Similar to Whites/Caucasians by College, 1 year or more
In terms of college, 1 year or more, the demographic groups most similar to Whites/Caucasians are Native Hawaiian (57.6%, a difference of 0.060%), Immigrants from Panama (57.6%, a difference of 0.070%), Immigrants from Costa Rica (57.5%, a difference of 0.12%), Immigrants from Ghana (57.4%, a difference of 0.19%), and Immigrants from Peru (57.7%, a difference of 0.30%).
| Demographics | Rating | Rank | College, 1 year or more |
| Immigrants | Senegal | 11.8 /100 | #212 | Poor 57.8% |
| French Canadians | 11.8 /100 | #213 | Poor 57.8% |
| Immigrants | Colombia | 11.6 /100 | #214 | Poor 57.8% |
| Tongans | 11.6 /100 | #215 | Poor 57.8% |
| Immigrants | Peru | 10.6 /100 | #216 | Poor 57.7% |
| Immigrants | Panama | 9.1 /100 | #217 | Tragic 57.6% |
| Native Hawaiians | 9.0 /100 | #218 | Tragic 57.6% |
| Whites/Caucasians | 8.7 /100 | #219 | Tragic 57.6% |
| Immigrants | Costa Rica | 8.0 /100 | #220 | Tragic 57.5% |
| Immigrants | Ghana | 7.7 /100 | #221 | Tragic 57.4% |
| Sub-Saharan Africans | 6.1 /100 | #222 | Tragic 57.3% |
| Portuguese | 5.4 /100 | #223 | Tragic 57.2% |
| Hmong | 5.4 /100 | #224 | Tragic 57.2% |
| Vietnamese | 4.7 /100 | #225 | Tragic 57.0% |
| Immigrants | Western Africa | 4.6 /100 | #226 | Tragic 57.0% |