Luxembourger vs Immigrants from Cambodia 2nd Grade
COMPARE
Luxembourger
Immigrants from Cambodia
2nd Grade
2nd Grade Comparison
Luxembourgers
Immigrants from Cambodia
98.4%
2ND GRADE
99.9/ 100
METRIC RATING
40th/ 347
METRIC RANK
96.4%
2ND GRADE
0.0/ 100
METRIC RATING
337th/ 347
METRIC RANK
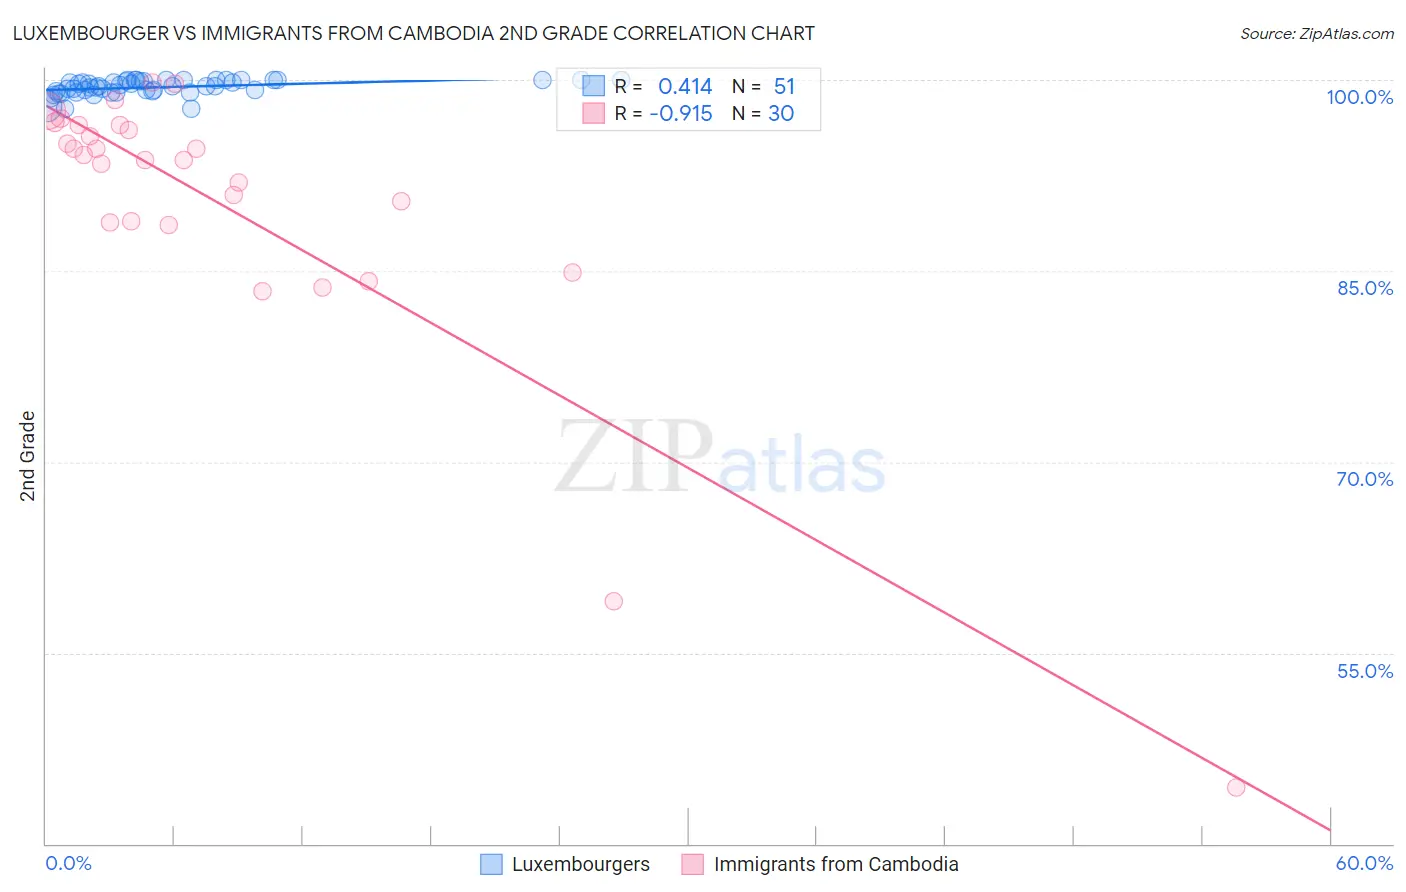
Luxembourger vs Immigrants from Cambodia 2nd Grade Correlation Chart
The statistical analysis conducted on geographies consisting of 144,675,804 people shows a moderate positive correlation between the proportion of Luxembourgers and percentage of population with at least 2nd grade education in the United States with a correlation coefficient (R) of 0.414 and weighted average of 98.4%. Similarly, the statistical analysis conducted on geographies consisting of 205,153,442 people shows a near-perfect negative correlation between the proportion of Immigrants from Cambodia and percentage of population with at least 2nd grade education in the United States with a correlation coefficient (R) of -0.915 and weighted average of 96.4%, a difference of 2.1%.
2nd Grade Correlation Summary
| Measurement | Luxembourger | Immigrants from Cambodia |
| Minimum | 97.8% | 44.4% |
| Maximum | 100.0% | 99.8% |
| Range | 2.2% | 55.4% |
| Mean | 99.4% | 90.2% |
| Median | 99.5% | 93.9% |
| Interquartile 25% (IQ1) | 99.1% | 88.8% |
| Interquartile 75% (IQ3) | 100.0% | 96.5% |
| Interquartile Range (IQR) | 0.87% | 7.7% |
| Standard Deviation (Sample) | 0.58% | 11.6% |
| Standard Deviation (Population) | 0.57% | 11.4% |
Similar Demographics by 2nd Grade
Demographics Similar to Luxembourgers by 2nd Grade
In terms of 2nd grade, the demographic groups most similar to Luxembourgers are Latvian (98.4%, a difference of 0.010%), Chippewa (98.4%, a difference of 0.010%), Eastern European (98.4%, a difference of 0.010%), Native Hawaiian (98.4%, a difference of 0.010%), and Italian (98.4%, a difference of 0.020%).
| Demographics | Rating | Rank | 2nd Grade |
| Scandinavians | 100.0 /100 | #33 | Exceptional 98.5% |
| Chinese | 100.0 /100 | #34 | Exceptional 98.5% |
| Swiss | 100.0 /100 | #35 | Exceptional 98.5% |
| British | 100.0 /100 | #36 | Exceptional 98.5% |
| Italians | 99.9 /100 | #37 | Exceptional 98.4% |
| Latvians | 99.9 /100 | #38 | Exceptional 98.4% |
| Chippewa | 99.9 /100 | #39 | Exceptional 98.4% |
| Luxembourgers | 99.9 /100 | #40 | Exceptional 98.4% |
| Eastern Europeans | 99.9 /100 | #41 | Exceptional 98.4% |
| Native Hawaiians | 99.9 /100 | #42 | Exceptional 98.4% |
| Belgians | 99.9 /100 | #43 | Exceptional 98.4% |
| Northern Europeans | 99.9 /100 | #44 | Exceptional 98.4% |
| Hungarians | 99.9 /100 | #45 | Exceptional 98.4% |
| Lumbee | 99.9 /100 | #46 | Exceptional 98.4% |
| Ottawa | 99.9 /100 | #47 | Exceptional 98.4% |
Demographics Similar to Immigrants from Cambodia by 2nd Grade
In terms of 2nd grade, the demographic groups most similar to Immigrants from Cambodia are Immigrants from Fiji (96.4%, a difference of 0.010%), Yakama (96.4%, a difference of 0.020%), Immigrants from Cabo Verde (96.3%, a difference of 0.020%), Central American (96.4%, a difference of 0.030%), and Immigrants from Dominican Republic (96.4%, a difference of 0.050%).
| Demographics | Rating | Rank | 2nd Grade |
| Immigrants | Latin America | 0.0 /100 | #330 | Tragic 96.5% |
| Immigrants | Armenia | 0.0 /100 | #331 | Tragic 96.5% |
| Bangladeshis | 0.0 /100 | #332 | Tragic 96.5% |
| Immigrants | Dominican Republic | 0.0 /100 | #333 | Tragic 96.4% |
| Central Americans | 0.0 /100 | #334 | Tragic 96.4% |
| Yakama | 0.0 /100 | #335 | Tragic 96.4% |
| Immigrants | Fiji | 0.0 /100 | #336 | Tragic 96.4% |
| Immigrants | Cambodia | 0.0 /100 | #337 | Tragic 96.4% |
| Immigrants | Cabo Verde | 0.0 /100 | #338 | Tragic 96.3% |
| Guatemalans | 0.0 /100 | #339 | Tragic 96.3% |
| Immigrants | Guatemala | 0.0 /100 | #340 | Tragic 96.2% |
| Immigrants | Central America | 0.0 /100 | #341 | Tragic 96.2% |
| Immigrants | Mexico | 0.0 /100 | #342 | Tragic 96.1% |
| Nepalese | 0.0 /100 | #343 | Tragic 96.1% |
| Salvadorans | 0.0 /100 | #344 | Tragic 96.0% |