Luxembourger vs Immigrants from Australia 2nd Grade
COMPARE
Luxembourger
Immigrants from Australia
2nd Grade
2nd Grade Comparison
Luxembourgers
Immigrants from Australia
98.4%
2ND GRADE
99.9/ 100
METRIC RATING
40th/ 347
METRIC RANK
98.2%
2ND GRADE
99.0/ 100
METRIC RATING
86th/ 347
METRIC RANK
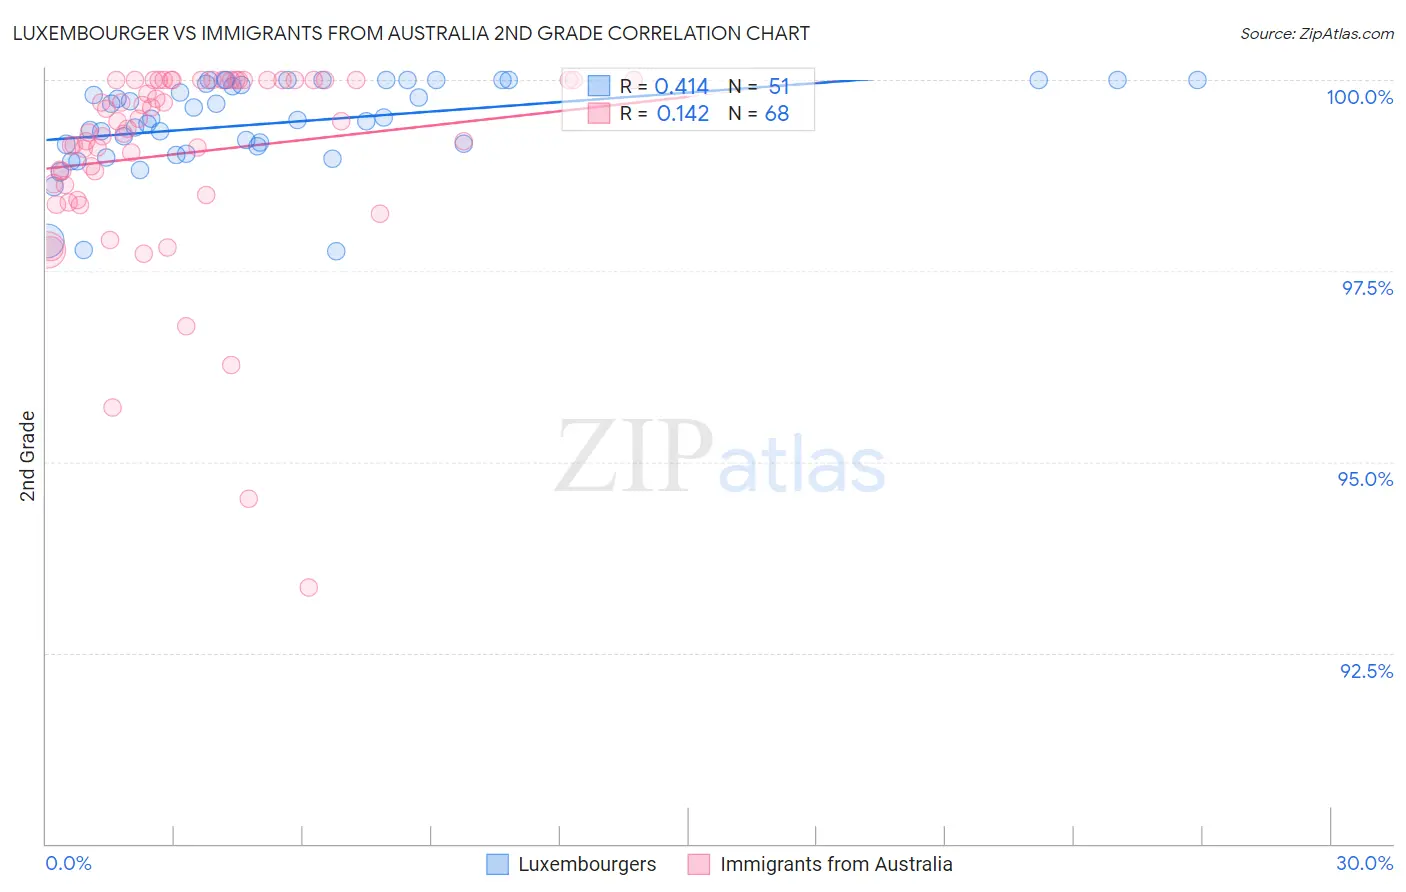
Luxembourger vs Immigrants from Australia 2nd Grade Correlation Chart
The statistical analysis conducted on geographies consisting of 144,675,804 people shows a moderate positive correlation between the proportion of Luxembourgers and percentage of population with at least 2nd grade education in the United States with a correlation coefficient (R) of 0.414 and weighted average of 98.4%. Similarly, the statistical analysis conducted on geographies consisting of 227,203,469 people shows a poor positive correlation between the proportion of Immigrants from Australia and percentage of population with at least 2nd grade education in the United States with a correlation coefficient (R) of 0.142 and weighted average of 98.2%, a difference of 0.21%.
2nd Grade Correlation Summary
| Measurement | Luxembourger | Immigrants from Australia |
| Minimum | 97.8% | 93.4% |
| Maximum | 100.0% | 100.0% |
| Range | 2.2% | 6.6% |
| Mean | 99.4% | 99.0% |
| Median | 99.5% | 99.4% |
| Interquartile 25% (IQ1) | 99.1% | 98.6% |
| Interquartile 75% (IQ3) | 100.0% | 100.0% |
| Interquartile Range (IQR) | 0.87% | 1.4% |
| Standard Deviation (Sample) | 0.58% | 1.3% |
| Standard Deviation (Population) | 0.57% | 1.3% |
Similar Demographics by 2nd Grade
Demographics Similar to Luxembourgers by 2nd Grade
In terms of 2nd grade, the demographic groups most similar to Luxembourgers are Latvian (98.4%, a difference of 0.010%), Chippewa (98.4%, a difference of 0.010%), Eastern European (98.4%, a difference of 0.010%), Native Hawaiian (98.4%, a difference of 0.010%), and Italian (98.4%, a difference of 0.020%).
| Demographics | Rating | Rank | 2nd Grade |
| Scandinavians | 100.0 /100 | #33 | Exceptional 98.5% |
| Chinese | 100.0 /100 | #34 | Exceptional 98.5% |
| Swiss | 100.0 /100 | #35 | Exceptional 98.5% |
| British | 100.0 /100 | #36 | Exceptional 98.5% |
| Italians | 99.9 /100 | #37 | Exceptional 98.4% |
| Latvians | 99.9 /100 | #38 | Exceptional 98.4% |
| Chippewa | 99.9 /100 | #39 | Exceptional 98.4% |
| Luxembourgers | 99.9 /100 | #40 | Exceptional 98.4% |
| Eastern Europeans | 99.9 /100 | #41 | Exceptional 98.4% |
| Native Hawaiians | 99.9 /100 | #42 | Exceptional 98.4% |
| Belgians | 99.9 /100 | #43 | Exceptional 98.4% |
| Northern Europeans | 99.9 /100 | #44 | Exceptional 98.4% |
| Hungarians | 99.9 /100 | #45 | Exceptional 98.4% |
| Lumbee | 99.9 /100 | #46 | Exceptional 98.4% |
| Ottawa | 99.9 /100 | #47 | Exceptional 98.4% |
Demographics Similar to Immigrants from Australia by 2nd Grade
In terms of 2nd grade, the demographic groups most similar to Immigrants from Australia are Potawatomi (98.2%, a difference of 0.0%), Immigrants from Denmark (98.2%, a difference of 0.0%), Macedonian (98.2%, a difference of 0.0%), Icelander (98.2%, a difference of 0.010%), and Delaware (98.2%, a difference of 0.010%).
| Demographics | Rating | Rank | 2nd Grade |
| Immigrants | Belgium | 99.3 /100 | #79 | Exceptional 98.2% |
| Osage | 99.2 /100 | #80 | Exceptional 98.2% |
| Icelanders | 99.2 /100 | #81 | Exceptional 98.2% |
| Delaware | 99.1 /100 | #82 | Exceptional 98.2% |
| Immigrants | Sweden | 99.1 /100 | #83 | Exceptional 98.2% |
| Hopi | 99.1 /100 | #84 | Exceptional 98.2% |
| Potawatomi | 99.1 /100 | #85 | Exceptional 98.2% |
| Immigrants | Australia | 99.0 /100 | #86 | Exceptional 98.2% |
| Immigrants | Denmark | 99.0 /100 | #87 | Exceptional 98.2% |
| Macedonians | 99.0 /100 | #88 | Exceptional 98.2% |
| Ukrainians | 98.9 /100 | #89 | Exceptional 98.2% |
| Zimbabweans | 98.8 /100 | #90 | Exceptional 98.2% |
| Immigrants | Western Europe | 98.8 /100 | #91 | Exceptional 98.2% |
| Immigrants | South Africa | 98.8 /100 | #92 | Exceptional 98.2% |
| Immigrants | India | 98.8 /100 | #93 | Exceptional 98.2% |