Korean vs Immigrants from Dominican Republic 3rd Grade
COMPARE
Korean
Immigrants from Dominican Republic
3rd Grade
3rd Grade Comparison
Koreans
Immigrants from Dominican Republic
97.4%
3RD GRADE
1.3/ 100
METRIC RATING
242nd/ 347
METRIC RANK
96.2%
3RD GRADE
0.0/ 100
METRIC RATING
335th/ 347
METRIC RANK
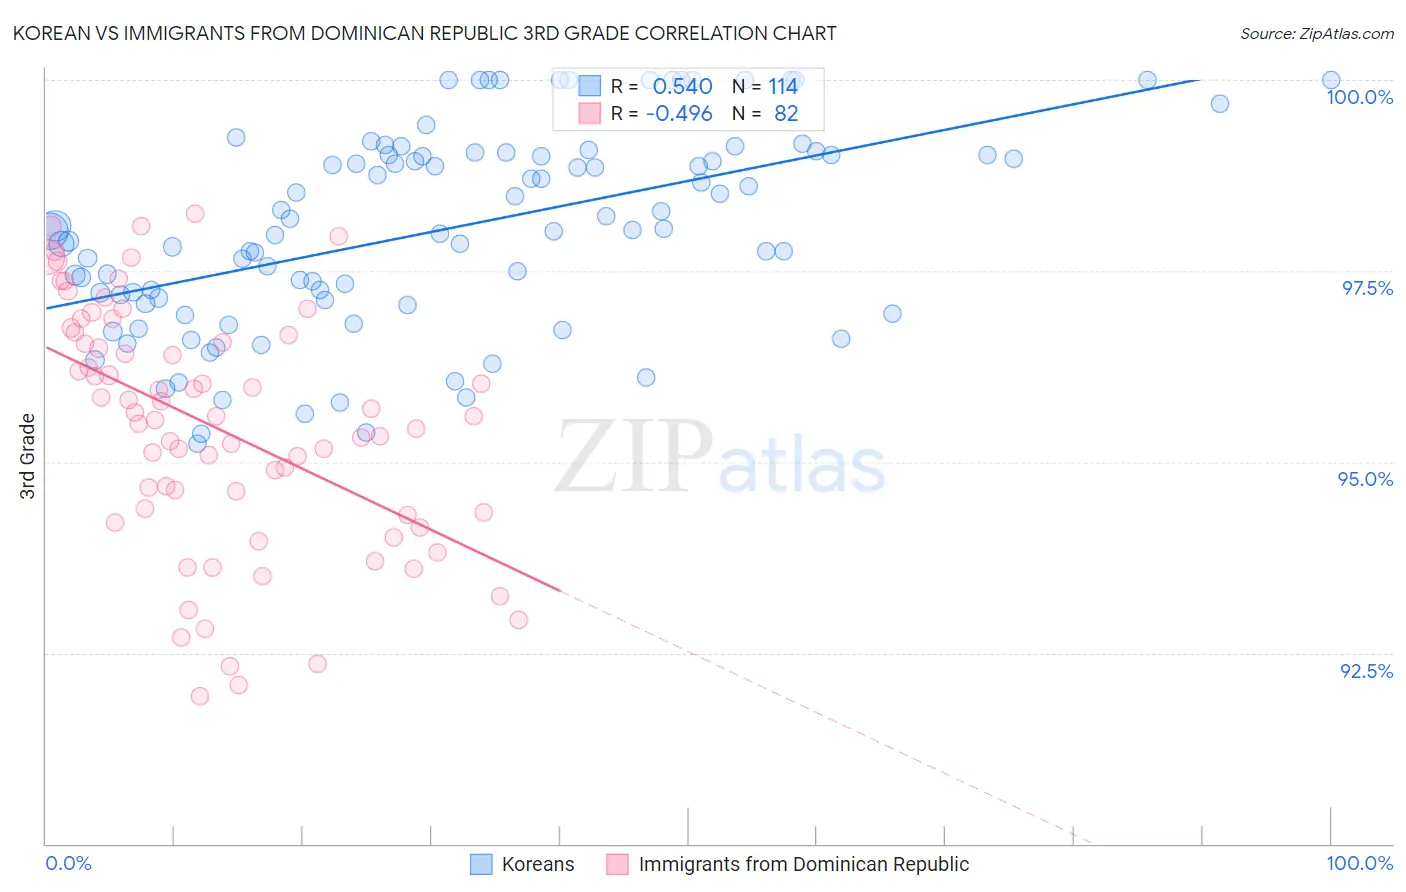
Korean vs Immigrants from Dominican Republic 3rd Grade Correlation Chart
The statistical analysis conducted on geographies consisting of 510,935,951 people shows a substantial positive correlation between the proportion of Koreans and percentage of population with at least 3rd grade education in the United States with a correlation coefficient (R) of 0.540 and weighted average of 97.4%. Similarly, the statistical analysis conducted on geographies consisting of 275,142,551 people shows a moderate negative correlation between the proportion of Immigrants from Dominican Republic and percentage of population with at least 3rd grade education in the United States with a correlation coefficient (R) of -0.496 and weighted average of 96.2%, a difference of 1.3%.
3rd Grade Correlation Summary
| Measurement | Korean | Immigrants from Dominican Republic |
| Minimum | 95.2% | 91.9% |
| Maximum | 100.0% | 98.3% |
| Range | 4.8% | 6.3% |
| Mean | 98.0% | 95.5% |
| Median | 98.0% | 95.6% |
| Interquartile 25% (IQ1) | 97.1% | 94.3% |
| Interquartile 75% (IQ3) | 99.0% | 96.7% |
| Interquartile Range (IQR) | 1.9% | 2.3% |
| Standard Deviation (Sample) | 1.3% | 1.6% |
| Standard Deviation (Population) | 1.3% | 1.6% |
Similar Demographics by 3rd Grade
Demographics Similar to Koreans by 3rd Grade
In terms of 3rd grade, the demographic groups most similar to Koreans are U.S. Virgin Islander (97.4%, a difference of 0.0%), Immigrants from Indonesia (97.4%, a difference of 0.0%), Nigerian (97.4%, a difference of 0.010%), Indian (Asian) (97.4%, a difference of 0.010%), and Asian (97.4%, a difference of 0.010%).
| Demographics | Rating | Rank | 3rd Grade |
| Immigrants | Iraq | 1.8 /100 | #235 | Tragic 97.4% |
| Liberians | 1.8 /100 | #236 | Tragic 97.4% |
| Colombians | 1.8 /100 | #237 | Tragic 97.4% |
| Immigrants | Uruguay | 1.7 /100 | #238 | Tragic 97.4% |
| Nigerians | 1.6 /100 | #239 | Tragic 97.4% |
| U.S. Virgin Islanders | 1.4 /100 | #240 | Tragic 97.4% |
| Immigrants | Indonesia | 1.4 /100 | #241 | Tragic 97.4% |
| Koreans | 1.3 /100 | #242 | Tragic 97.4% |
| Indians (Asian) | 1.3 /100 | #243 | Tragic 97.4% |
| Asians | 1.1 /100 | #244 | Tragic 97.4% |
| Ethiopians | 1.1 /100 | #245 | Tragic 97.4% |
| Immigrants | Senegal | 1.0 /100 | #246 | Tragic 97.4% |
| Assyrians/Chaldeans/Syriacs | 1.0 /100 | #247 | Tragic 97.4% |
| Immigrants | Eastern Africa | 0.9 /100 | #248 | Tragic 97.4% |
| South Americans | 0.9 /100 | #249 | Tragic 97.4% |
Demographics Similar to Immigrants from Dominican Republic by 3rd Grade
In terms of 3rd grade, the demographic groups most similar to Immigrants from Dominican Republic are Immigrants from Cambodia (96.2%, a difference of 0.0%), Immigrants from Cabo Verde (96.2%, a difference of 0.010%), Immigrants from Fiji (96.2%, a difference of 0.020%), Mexican (96.2%, a difference of 0.050%), and Immigrants from Latin America (96.2%, a difference of 0.060%).
| Demographics | Rating | Rank | 3rd Grade |
| Bangladeshis | 0.0 /100 | #328 | Tragic 96.3% |
| Immigrants | Honduras | 0.0 /100 | #329 | Tragic 96.3% |
| Immigrants | Armenia | 0.0 /100 | #330 | Tragic 96.3% |
| Immigrants | Latin America | 0.0 /100 | #331 | Tragic 96.2% |
| Mexicans | 0.0 /100 | #332 | Tragic 96.2% |
| Immigrants | Fiji | 0.0 /100 | #333 | Tragic 96.2% |
| Immigrants | Cambodia | 0.0 /100 | #334 | Tragic 96.2% |
| Immigrants | Dominican Republic | 0.0 /100 | #335 | Tragic 96.2% |
| Immigrants | Cabo Verde | 0.0 /100 | #336 | Tragic 96.2% |
| Central Americans | 0.0 /100 | #337 | Tragic 96.1% |
| Guatemalans | 0.0 /100 | #338 | Tragic 96.0% |
| Yakama | 0.0 /100 | #339 | Tragic 95.9% |
| Nepalese | 0.0 /100 | #340 | Tragic 95.9% |
| Immigrants | Central America | 0.0 /100 | #341 | Tragic 95.8% |
| Immigrants | Guatemala | 0.0 /100 | #342 | Tragic 95.8% |