Central American Indian vs Immigrants from Dominican Republic 3rd Grade
COMPARE
Central American Indian
Immigrants from Dominican Republic
3rd Grade
3rd Grade Comparison
Central American Indians
Immigrants from Dominican Republic
96.7%
3RD GRADE
0.0/ 100
METRIC RATING
305th/ 347
METRIC RANK
96.2%
3RD GRADE
0.0/ 100
METRIC RATING
335th/ 347
METRIC RANK
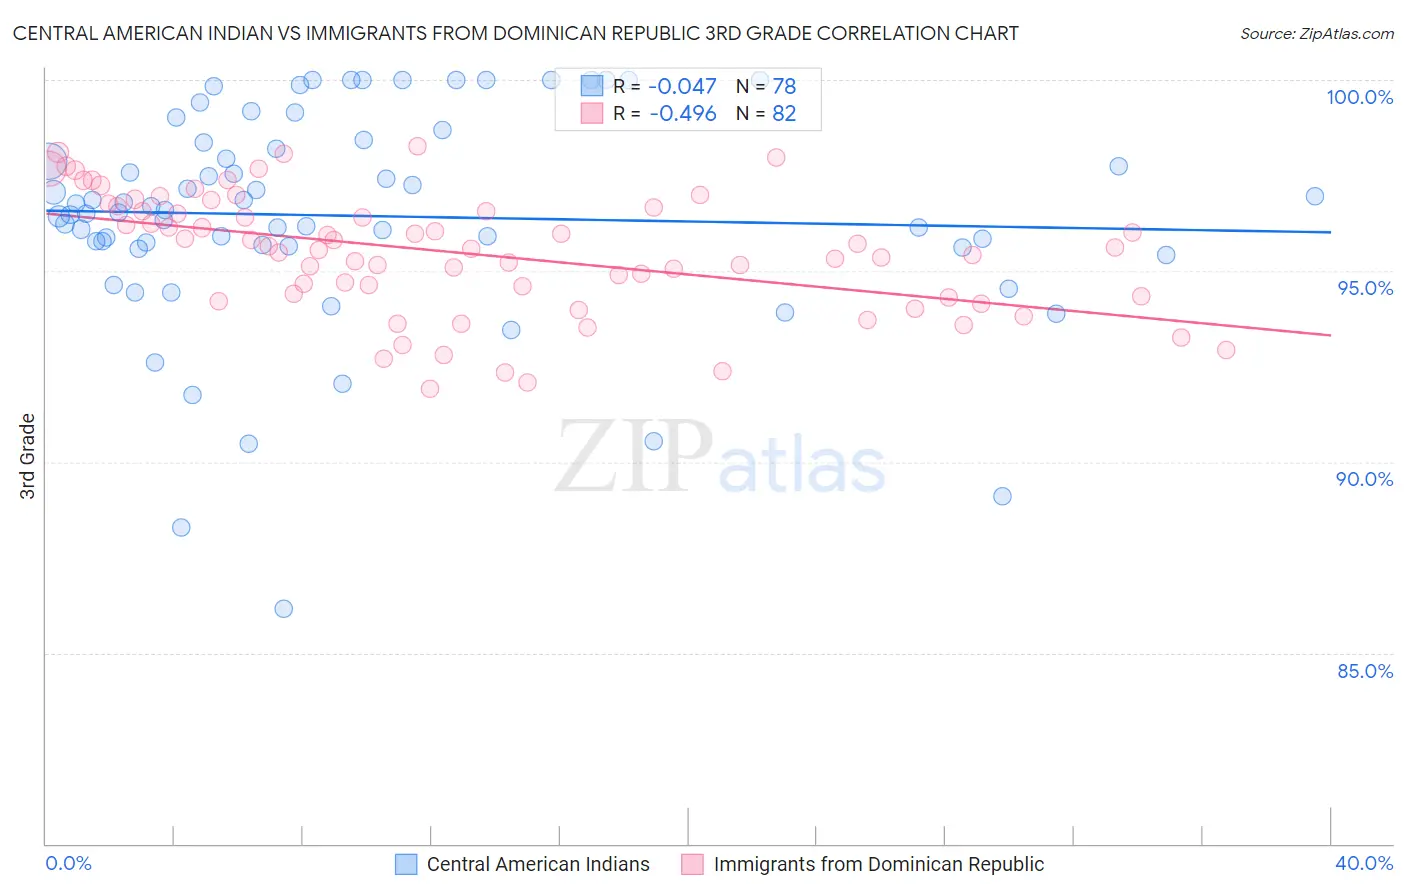
Central American Indian vs Immigrants from Dominican Republic 3rd Grade Correlation Chart
The statistical analysis conducted on geographies consisting of 326,141,205 people shows no correlation between the proportion of Central American Indians and percentage of population with at least 3rd grade education in the United States with a correlation coefficient (R) of -0.047 and weighted average of 96.7%. Similarly, the statistical analysis conducted on geographies consisting of 275,142,551 people shows a moderate negative correlation between the proportion of Immigrants from Dominican Republic and percentage of population with at least 3rd grade education in the United States with a correlation coefficient (R) of -0.496 and weighted average of 96.2%, a difference of 0.56%.
3rd Grade Correlation Summary
| Measurement | Central American Indian | Immigrants from Dominican Republic |
| Minimum | 86.2% | 91.9% |
| Maximum | 100.0% | 98.3% |
| Range | 13.8% | 6.3% |
| Mean | 96.4% | 95.5% |
| Median | 96.6% | 95.6% |
| Interquartile 25% (IQ1) | 95.6% | 94.3% |
| Interquartile 75% (IQ3) | 98.4% | 96.7% |
| Interquartile Range (IQR) | 2.7% | 2.3% |
| Standard Deviation (Sample) | 2.8% | 1.6% |
| Standard Deviation (Population) | 2.8% | 1.6% |
Similar Demographics by 3rd Grade
Demographics Similar to Central American Indians by 3rd Grade
In terms of 3rd grade, the demographic groups most similar to Central American Indians are Immigrants from Caribbean (96.7%, a difference of 0.010%), Immigrants from Somalia (96.8%, a difference of 0.030%), Ecuadorian (96.7%, a difference of 0.030%), Guyanese (96.7%, a difference of 0.030%), and Nicaraguan (96.7%, a difference of 0.050%).
| Demographics | Rating | Rank | 3rd Grade |
| Immigrants | Dominica | 0.0 /100 | #298 | Tragic 96.9% |
| Somalis | 0.0 /100 | #299 | Tragic 96.8% |
| Immigrants | South Eastern Asia | 0.0 /100 | #300 | Tragic 96.8% |
| Immigrants | Cuba | 0.0 /100 | #301 | Tragic 96.8% |
| Immigrants | Somalia | 0.0 /100 | #302 | Tragic 96.8% |
| Ecuadorians | 0.0 /100 | #303 | Tragic 96.7% |
| Immigrants | Caribbean | 0.0 /100 | #304 | Tragic 96.7% |
| Central American Indians | 0.0 /100 | #305 | Tragic 96.7% |
| Guyanese | 0.0 /100 | #306 | Tragic 96.7% |
| Nicaraguans | 0.0 /100 | #307 | Tragic 96.7% |
| Immigrants | Haiti | 0.0 /100 | #308 | Tragic 96.7% |
| Sri Lankans | 0.0 /100 | #309 | Tragic 96.7% |
| Cape Verdeans | 0.0 /100 | #310 | Tragic 96.6% |
| Immigrants | Guyana | 0.0 /100 | #311 | Tragic 96.6% |
| Immigrants | Laos | 0.0 /100 | #312 | Tragic 96.6% |
Demographics Similar to Immigrants from Dominican Republic by 3rd Grade
In terms of 3rd grade, the demographic groups most similar to Immigrants from Dominican Republic are Immigrants from Cambodia (96.2%, a difference of 0.0%), Immigrants from Cabo Verde (96.2%, a difference of 0.010%), Immigrants from Fiji (96.2%, a difference of 0.020%), Mexican (96.2%, a difference of 0.050%), and Immigrants from Latin America (96.2%, a difference of 0.060%).
| Demographics | Rating | Rank | 3rd Grade |
| Bangladeshis | 0.0 /100 | #328 | Tragic 96.3% |
| Immigrants | Honduras | 0.0 /100 | #329 | Tragic 96.3% |
| Immigrants | Armenia | 0.0 /100 | #330 | Tragic 96.3% |
| Immigrants | Latin America | 0.0 /100 | #331 | Tragic 96.2% |
| Mexicans | 0.0 /100 | #332 | Tragic 96.2% |
| Immigrants | Fiji | 0.0 /100 | #333 | Tragic 96.2% |
| Immigrants | Cambodia | 0.0 /100 | #334 | Tragic 96.2% |
| Immigrants | Dominican Republic | 0.0 /100 | #335 | Tragic 96.2% |
| Immigrants | Cabo Verde | 0.0 /100 | #336 | Tragic 96.2% |
| Central Americans | 0.0 /100 | #337 | Tragic 96.1% |
| Guatemalans | 0.0 /100 | #338 | Tragic 96.0% |
| Yakama | 0.0 /100 | #339 | Tragic 95.9% |
| Nepalese | 0.0 /100 | #340 | Tragic 95.9% |
| Immigrants | Central America | 0.0 /100 | #341 | Tragic 95.8% |
| Immigrants | Guatemala | 0.0 /100 | #342 | Tragic 95.8% |