Iraqi vs Malaysian 8th Grade
COMPARE
Iraqi
Malaysian
8th Grade
8th Grade Comparison
Iraqis
Malaysians
95.7%
8TH GRADE
40.5/ 100
METRIC RATING
180th/ 347
METRIC RANK
94.5%
8TH GRADE
0.0/ 100
METRIC RATING
288th/ 347
METRIC RANK
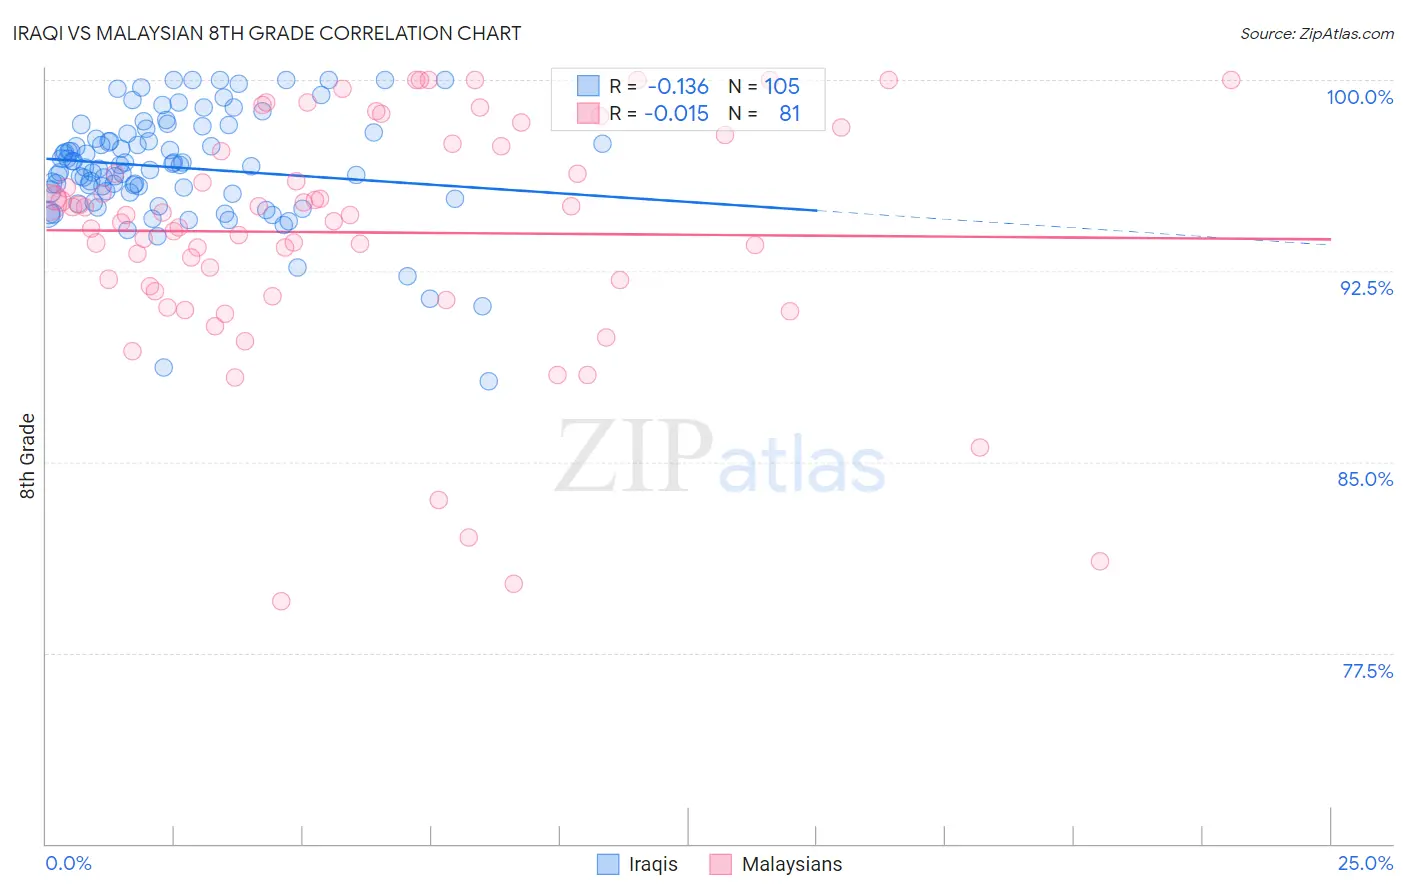
Iraqi vs Malaysian 8th Grade Correlation Chart
The statistical analysis conducted on geographies consisting of 170,614,457 people shows a poor negative correlation between the proportion of Iraqis and percentage of population with at least 8th grade education in the United States with a correlation coefficient (R) of -0.136 and weighted average of 95.7%. Similarly, the statistical analysis conducted on geographies consisting of 226,107,000 people shows no correlation between the proportion of Malaysians and percentage of population with at least 8th grade education in the United States with a correlation coefficient (R) of -0.015 and weighted average of 94.5%, a difference of 1.3%.
8th Grade Correlation Summary
| Measurement | Iraqi | Malaysian |
| Minimum | 88.2% | 79.5% |
| Maximum | 100.0% | 100.0% |
| Range | 11.8% | 20.5% |
| Mean | 96.6% | 94.0% |
| Median | 96.7% | 94.7% |
| Interquartile 25% (IQ1) | 95.6% | 91.8% |
| Interquartile 75% (IQ3) | 97.9% | 97.4% |
| Interquartile Range (IQR) | 2.3% | 5.6% |
| Standard Deviation (Sample) | 2.2% | 4.7% |
| Standard Deviation (Population) | 2.2% | 4.6% |
Similar Demographics by 8th Grade
Demographics Similar to Iraqis by 8th Grade
In terms of 8th grade, the demographic groups most similar to Iraqis are Immigrants from Spain (95.7%, a difference of 0.010%), Immigrants from Egypt (95.7%, a difference of 0.020%), Immigrants from Brazil (95.7%, a difference of 0.030%), Immigrants from Iraq (95.6%, a difference of 0.030%), and Immigrants from Uganda (95.6%, a difference of 0.030%).
| Demographics | Rating | Rank | 8th Grade |
| Mongolians | 53.0 /100 | #173 | Average 95.8% |
| Chileans | 50.0 /100 | #174 | Average 95.7% |
| Immigrants | Albania | 49.6 /100 | #175 | Average 95.7% |
| Pakistanis | 48.8 /100 | #176 | Average 95.7% |
| Marshallese | 47.6 /100 | #177 | Average 95.7% |
| Venezuelans | 47.5 /100 | #178 | Average 95.7% |
| Immigrants | Brazil | 45.4 /100 | #179 | Average 95.7% |
| Iraqis | 40.5 /100 | #180 | Average 95.7% |
| Immigrants | Spain | 38.7 /100 | #181 | Fair 95.7% |
| Immigrants | Egypt | 37.9 /100 | #182 | Fair 95.7% |
| Immigrants | Iraq | 36.2 /100 | #183 | Fair 95.6% |
| Immigrants | Uganda | 36.0 /100 | #184 | Fair 95.6% |
| Blacks/African Americans | 34.8 /100 | #185 | Fair 95.6% |
| Brazilians | 34.8 /100 | #186 | Fair 95.6% |
| Sudanese | 33.0 /100 | #187 | Fair 95.6% |
Demographics Similar to Malaysians by 8th Grade
In terms of 8th grade, the demographic groups most similar to Malaysians are Tohono O'odham (94.5%, a difference of 0.020%), Immigrants from Peru (94.5%, a difference of 0.030%), British West Indian (94.4%, a difference of 0.060%), Immigrants from Barbados (94.5%, a difference of 0.080%), and Immigrants from Philippines (94.6%, a difference of 0.11%).
| Demographics | Rating | Rank | 8th Grade |
| Immigrants | Bolivia | 0.1 /100 | #281 | Tragic 94.6% |
| Immigrants | Eritrea | 0.1 /100 | #282 | Tragic 94.6% |
| Immigrants | St. Vincent and the Grenadines | 0.1 /100 | #283 | Tragic 94.6% |
| Immigrants | Philippines | 0.1 /100 | #284 | Tragic 94.6% |
| Immigrants | Barbados | 0.0 /100 | #285 | Tragic 94.5% |
| Immigrants | Peru | 0.0 /100 | #286 | Tragic 94.5% |
| Tohono O'odham | 0.0 /100 | #287 | Tragic 94.5% |
| Malaysians | 0.0 /100 | #288 | Tragic 94.5% |
| British West Indians | 0.0 /100 | #289 | Tragic 94.4% |
| Immigrants | West Indies | 0.0 /100 | #290 | Tragic 94.3% |
| Immigrants | Grenada | 0.0 /100 | #291 | Tragic 94.3% |
| Bangladeshis | 0.0 /100 | #292 | Tragic 94.3% |
| Yaqui | 0.0 /100 | #293 | Tragic 94.2% |
| Houma | 0.0 /100 | #294 | Tragic 94.2% |
| Fijians | 0.0 /100 | #295 | Tragic 94.2% |