Iraqi vs Immigrants from Armenia 8th Grade
COMPARE
Iraqi
Immigrants from Armenia
8th Grade
8th Grade Comparison
Iraqis
Immigrants from Armenia
95.7%
8TH GRADE
40.5/ 100
METRIC RATING
180th/ 347
METRIC RANK
92.3%
8TH GRADE
0.0/ 100
METRIC RATING
330th/ 347
METRIC RANK
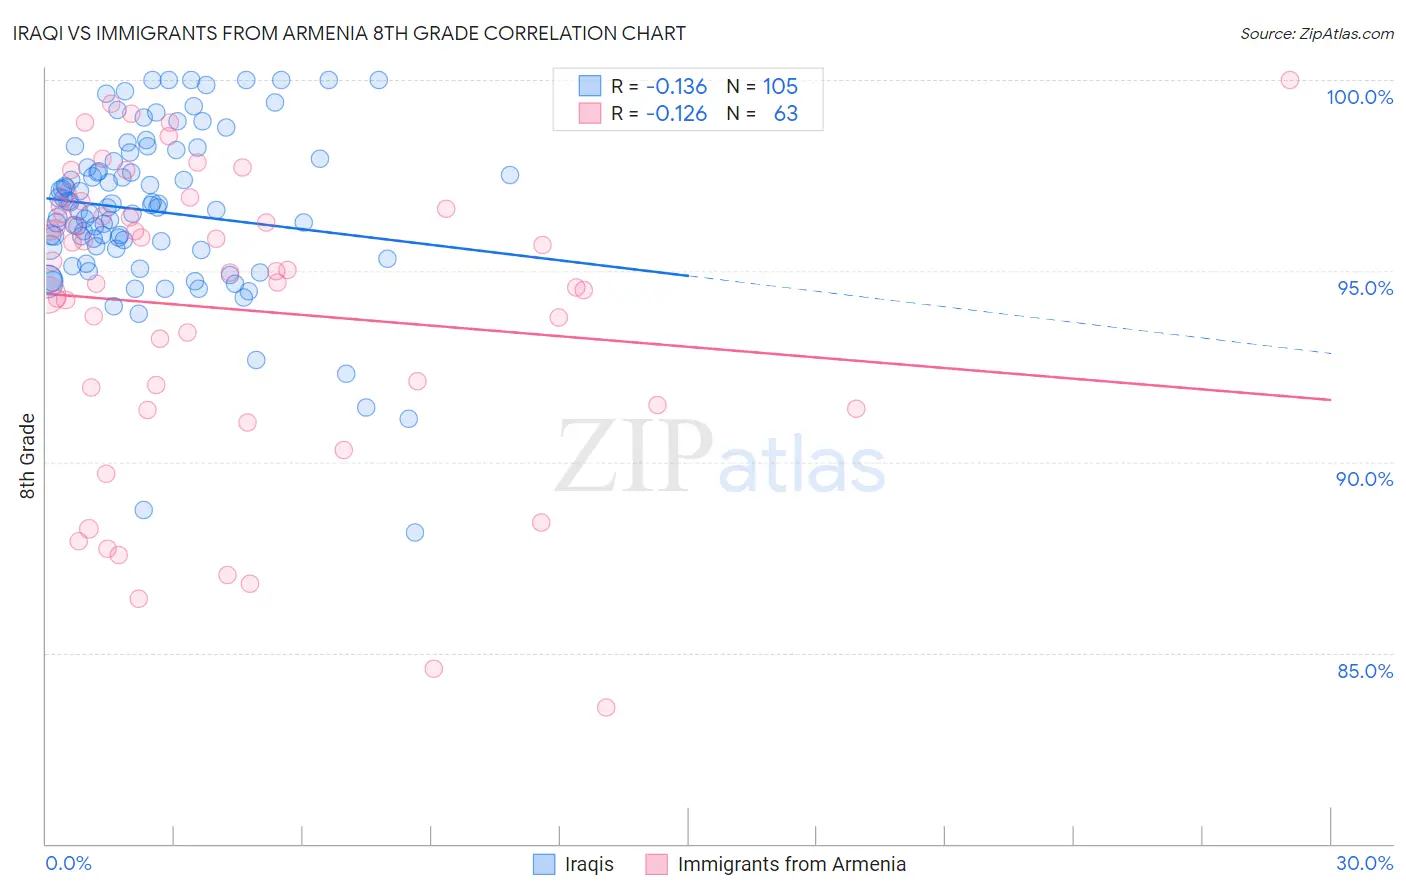
Iraqi vs Immigrants from Armenia 8th Grade Correlation Chart
The statistical analysis conducted on geographies consisting of 170,614,457 people shows a poor negative correlation between the proportion of Iraqis and percentage of population with at least 8th grade education in the United States with a correlation coefficient (R) of -0.136 and weighted average of 95.7%. Similarly, the statistical analysis conducted on geographies consisting of 97,657,339 people shows a poor negative correlation between the proportion of Immigrants from Armenia and percentage of population with at least 8th grade education in the United States with a correlation coefficient (R) of -0.126 and weighted average of 92.3%, a difference of 3.6%.
8th Grade Correlation Summary
| Measurement | Iraqi | Immigrants from Armenia |
| Minimum | 88.2% | 83.6% |
| Maximum | 100.0% | 100.0% |
| Range | 11.8% | 16.4% |
| Mean | 96.6% | 94.0% |
| Median | 96.7% | 95.0% |
| Interquartile 25% (IQ1) | 95.6% | 91.5% |
| Interquartile 75% (IQ3) | 97.9% | 96.6% |
| Interquartile Range (IQR) | 2.3% | 5.1% |
| Standard Deviation (Sample) | 2.2% | 3.9% |
| Standard Deviation (Population) | 2.2% | 3.9% |
Similar Demographics by 8th Grade
Demographics Similar to Iraqis by 8th Grade
In terms of 8th grade, the demographic groups most similar to Iraqis are Immigrants from Spain (95.7%, a difference of 0.010%), Immigrants from Egypt (95.7%, a difference of 0.020%), Immigrants from Brazil (95.7%, a difference of 0.030%), Immigrants from Iraq (95.6%, a difference of 0.030%), and Immigrants from Uganda (95.6%, a difference of 0.030%).
| Demographics | Rating | Rank | 8th Grade |
| Mongolians | 53.0 /100 | #173 | Average 95.8% |
| Chileans | 50.0 /100 | #174 | Average 95.7% |
| Immigrants | Albania | 49.6 /100 | #175 | Average 95.7% |
| Pakistanis | 48.8 /100 | #176 | Average 95.7% |
| Marshallese | 47.6 /100 | #177 | Average 95.7% |
| Venezuelans | 47.5 /100 | #178 | Average 95.7% |
| Immigrants | Brazil | 45.4 /100 | #179 | Average 95.7% |
| Iraqis | 40.5 /100 | #180 | Average 95.7% |
| Immigrants | Spain | 38.7 /100 | #181 | Fair 95.7% |
| Immigrants | Egypt | 37.9 /100 | #182 | Fair 95.7% |
| Immigrants | Iraq | 36.2 /100 | #183 | Fair 95.6% |
| Immigrants | Uganda | 36.0 /100 | #184 | Fair 95.6% |
| Blacks/African Americans | 34.8 /100 | #185 | Fair 95.6% |
| Brazilians | 34.8 /100 | #186 | Fair 95.6% |
| Sudanese | 33.0 /100 | #187 | Fair 95.6% |
Demographics Similar to Immigrants from Armenia by 8th Grade
In terms of 8th grade, the demographic groups most similar to Immigrants from Armenia are Honduran (92.3%, a difference of 0.010%), Immigrants from Dominican Republic (92.3%, a difference of 0.020%), Immigrants from Cabo Verde (92.4%, a difference of 0.090%), Hispanic or Latino (92.2%, a difference of 0.14%), and Immigrants from Nicaragua (92.5%, a difference of 0.15%).
| Demographics | Rating | Rank | 8th Grade |
| Immigrants | Belize | 0.0 /100 | #323 | Tragic 92.9% |
| Nepalese | 0.0 /100 | #324 | Tragic 92.8% |
| Dominicans | 0.0 /100 | #325 | Tragic 92.8% |
| Central American Indians | 0.0 /100 | #326 | Tragic 92.7% |
| Immigrants | Azores | 0.0 /100 | #327 | Tragic 92.5% |
| Immigrants | Nicaragua | 0.0 /100 | #328 | Tragic 92.5% |
| Immigrants | Cabo Verde | 0.0 /100 | #329 | Tragic 92.4% |
| Immigrants | Armenia | 0.0 /100 | #330 | Tragic 92.3% |
| Hondurans | 0.0 /100 | #331 | Tragic 92.3% |
| Immigrants | Dominican Republic | 0.0 /100 | #332 | Tragic 92.3% |
| Hispanics or Latinos | 0.0 /100 | #333 | Tragic 92.2% |
| Immigrants | Yemen | 0.0 /100 | #334 | Tragic 92.1% |
| Mexican American Indians | 0.0 /100 | #335 | Tragic 92.1% |
| Immigrants | Honduras | 0.0 /100 | #336 | Tragic 91.9% |
| Immigrants | Latin America | 0.0 /100 | #337 | Tragic 91.7% |