Iranian vs Immigrants from Serbia Kindergarten
COMPARE
Iranian
Immigrants from Serbia
Kindergarten
Kindergarten Comparison
Iranians
Immigrants from Serbia
98.2%
KINDERGARTEN
96.2/ 100
METRIC RATING
115th/ 347
METRIC RANK
98.1%
KINDERGARTEN
92.4/ 100
METRIC RATING
128th/ 347
METRIC RANK
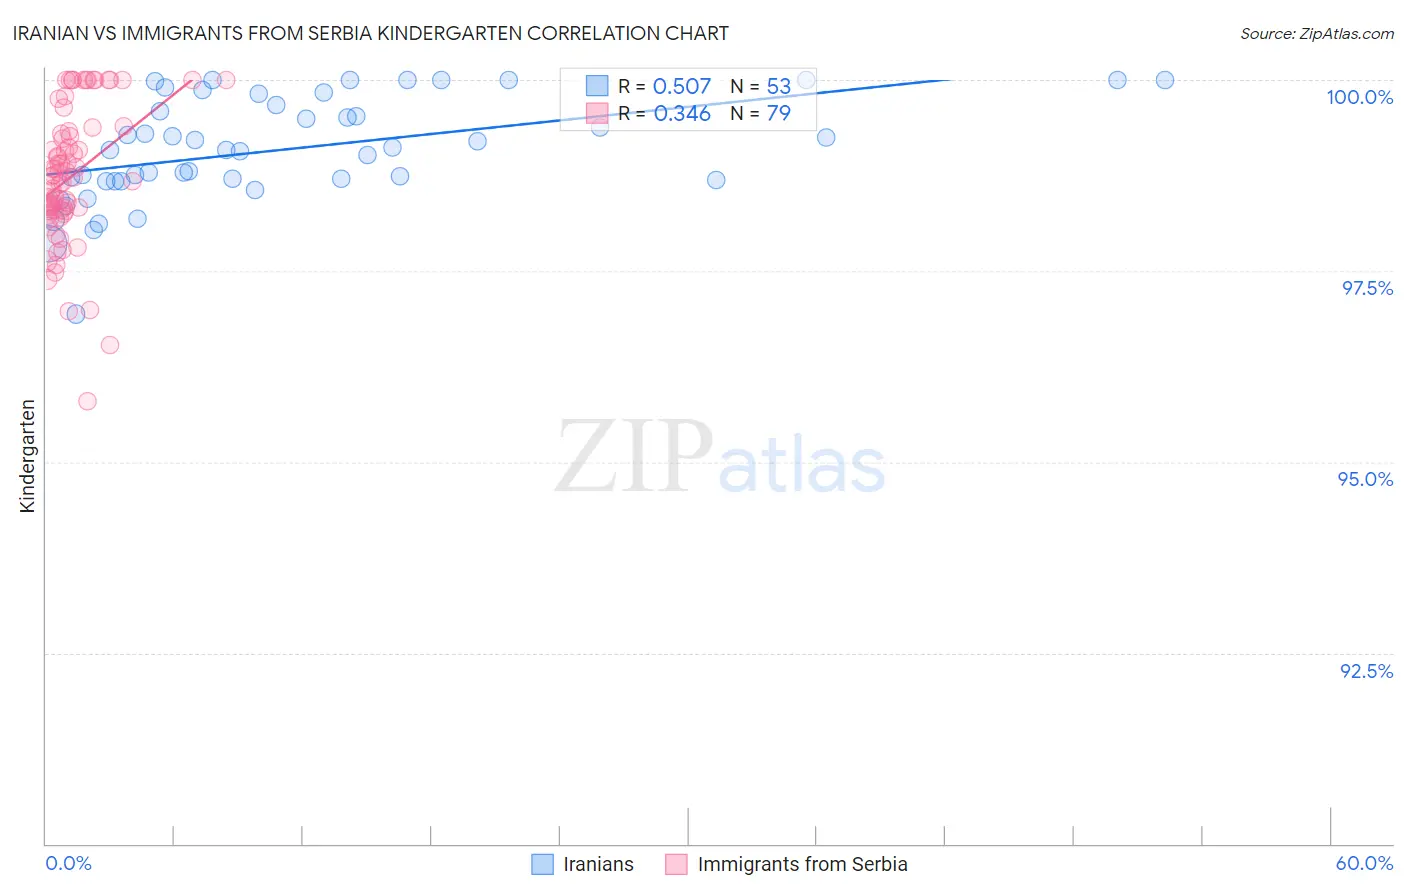
Iranian vs Immigrants from Serbia Kindergarten Correlation Chart
The statistical analysis conducted on geographies consisting of 316,902,340 people shows a substantial positive correlation between the proportion of Iranians and percentage of population with at least kindergarten education in the United States with a correlation coefficient (R) of 0.507 and weighted average of 98.2%. Similarly, the statistical analysis conducted on geographies consisting of 131,729,423 people shows a mild positive correlation between the proportion of Immigrants from Serbia and percentage of population with at least kindergarten education in the United States with a correlation coefficient (R) of 0.346 and weighted average of 98.1%, a difference of 0.060%.
Kindergarten Correlation Summary
| Measurement | Iranian | Immigrants from Serbia |
| Minimum | 96.9% | 95.8% |
| Maximum | 100.0% | 100.0% |
| Range | 3.1% | 4.2% |
| Mean | 99.1% | 98.7% |
| Median | 99.1% | 98.7% |
| Interquartile 25% (IQ1) | 98.7% | 98.3% |
| Interquartile 75% (IQ3) | 99.7% | 99.3% |
| Interquartile Range (IQR) | 1.1% | 1.0% |
| Standard Deviation (Sample) | 0.69% | 0.89% |
| Standard Deviation (Population) | 0.68% | 0.88% |
Demographics Similar to Iranians and Immigrants from Serbia by Kindergarten
In terms of kindergarten, the demographic groups most similar to Iranians are Immigrants from Latvia (98.2%, a difference of 0.0%), Ute (98.2%, a difference of 0.0%), Immigrants from Norway (98.2%, a difference of 0.010%), Immigrants from Czechoslovakia (98.2%, a difference of 0.010%), and Spanish (98.2%, a difference of 0.010%). Similarly, the demographic groups most similar to Immigrants from Serbia are Syrian (98.2%, a difference of 0.010%), Iroquois (98.2%, a difference of 0.010%), Lebanese (98.2%, a difference of 0.010%), Immigrants from Saudi Arabia (98.1%, a difference of 0.010%), and Seminole (98.1%, a difference of 0.010%).
| Demographics | Rating | Rank | Kindergarten |
| Immigrants | Norway | 96.6 /100 | #111 | Exceptional 98.2% |
| Immigrants | Czechoslovakia | 96.6 /100 | #112 | Exceptional 98.2% |
| Immigrants | Latvia | 96.3 /100 | #113 | Exceptional 98.2% |
| Ute | 96.3 /100 | #114 | Exceptional 98.2% |
| Iranians | 96.2 /100 | #115 | Exceptional 98.2% |
| Spanish | 95.8 /100 | #116 | Exceptional 98.2% |
| Immigrants | France | 95.5 /100 | #117 | Exceptional 98.2% |
| Yugoslavians | 95.5 /100 | #118 | Exceptional 98.2% |
| Thais | 94.8 /100 | #119 | Exceptional 98.2% |
| Okinawans | 94.4 /100 | #120 | Exceptional 98.2% |
| Immigrants | Zimbabwe | 94.0 /100 | #121 | Exceptional 98.2% |
| Immigrants | Japan | 94.0 /100 | #122 | Exceptional 98.2% |
| Menominee | 93.9 /100 | #123 | Exceptional 98.2% |
| Syrians | 93.6 /100 | #124 | Exceptional 98.2% |
| Iroquois | 93.5 /100 | #125 | Exceptional 98.2% |
| Lebanese | 93.5 /100 | #126 | Exceptional 98.2% |
| Immigrants | Saudi Arabia | 93.1 /100 | #127 | Exceptional 98.1% |
| Immigrants | Serbia | 92.4 /100 | #128 | Exceptional 98.1% |
| Seminole | 91.5 /100 | #129 | Exceptional 98.1% |
| Immigrants | Croatia | 91.2 /100 | #130 | Exceptional 98.1% |
| Cambodians | 91.2 /100 | #131 | Exceptional 98.1% |