Indonesian vs Paraguayan 7th Grade
COMPARE
Indonesian
Paraguayan
7th Grade
7th Grade Comparison
Indonesians
Paraguayans
94.5%
7TH GRADE
0.0/ 100
METRIC RATING
298th/ 347
METRIC RANK
95.9%
7TH GRADE
24.8/ 100
METRIC RATING
198th/ 347
METRIC RANK
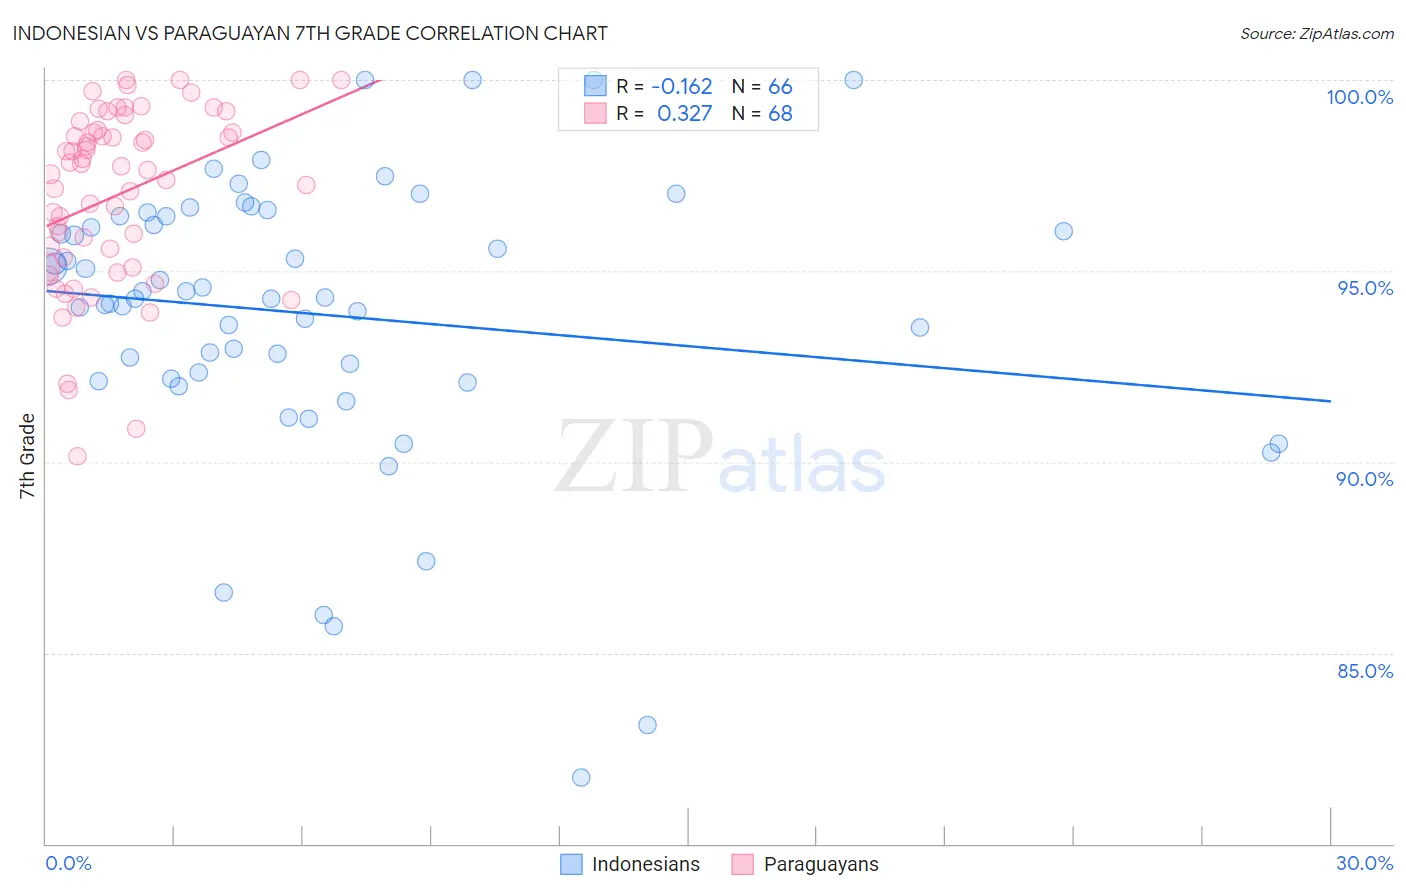
Indonesian vs Paraguayan 7th Grade Correlation Chart
The statistical analysis conducted on geographies consisting of 162,727,113 people shows a poor negative correlation between the proportion of Indonesians and percentage of population with at least 7th grade education in the United States with a correlation coefficient (R) of -0.162 and weighted average of 94.5%. Similarly, the statistical analysis conducted on geographies consisting of 95,115,093 people shows a mild positive correlation between the proportion of Paraguayans and percentage of population with at least 7th grade education in the United States with a correlation coefficient (R) of 0.327 and weighted average of 95.9%, a difference of 1.4%.
7th Grade Correlation Summary
| Measurement | Indonesian | Paraguayan |
| Minimum | 81.7% | 90.2% |
| Maximum | 100.0% | 100.0% |
| Range | 18.3% | 9.8% |
| Mean | 93.9% | 97.0% |
| Median | 94.3% | 97.7% |
| Interquartile 25% (IQ1) | 92.2% | 95.2% |
| Interquartile 75% (IQ3) | 96.4% | 98.7% |
| Interquartile Range (IQR) | 4.3% | 3.4% |
| Standard Deviation (Sample) | 3.7% | 2.3% |
| Standard Deviation (Population) | 3.7% | 2.3% |
Similar Demographics by 7th Grade
Demographics Similar to Indonesians by 7th Grade
In terms of 7th grade, the demographic groups most similar to Indonesians are Immigrants from South Eastern Asia (94.5%, a difference of 0.0%), Bangladeshi (94.5%, a difference of 0.010%), Immigrants from Burma/Myanmar (94.5%, a difference of 0.040%), Immigrants from Dominica (94.5%, a difference of 0.070%), and Immigrants from Laos (94.5%, a difference of 0.070%).
| Demographics | Rating | Rank | 7th Grade |
| Immigrants | Grenada | 0.0 /100 | #291 | Tragic 94.8% |
| Immigrants | West Indies | 0.0 /100 | #292 | Tragic 94.8% |
| Fijians | 0.0 /100 | #293 | Tragic 94.7% |
| Haitians | 0.0 /100 | #294 | Tragic 94.7% |
| Yaqui | 0.0 /100 | #295 | Tragic 94.6% |
| Cubans | 0.0 /100 | #296 | Tragic 94.6% |
| Immigrants | South Eastern Asia | 0.0 /100 | #297 | Tragic 94.5% |
| Indonesians | 0.0 /100 | #298 | Tragic 94.5% |
| Bangladeshis | 0.0 /100 | #299 | Tragic 94.5% |
| Immigrants | Burma/Myanmar | 0.0 /100 | #300 | Tragic 94.5% |
| Immigrants | Dominica | 0.0 /100 | #301 | Tragic 94.5% |
| Immigrants | Laos | 0.0 /100 | #302 | Tragic 94.5% |
| Sri Lankans | 0.0 /100 | #303 | Tragic 94.4% |
| Immigrants | Haiti | 0.0 /100 | #304 | Tragic 94.3% |
| Guyanese | 0.0 /100 | #305 | Tragic 94.3% |
Demographics Similar to Paraguayans by 7th Grade
In terms of 7th grade, the demographic groups most similar to Paraguayans are Guamanian/Chamorro (95.9%, a difference of 0.010%), Argentinean (95.9%, a difference of 0.010%), Apache (95.9%, a difference of 0.020%), Immigrants from Zaire (95.9%, a difference of 0.020%), and Immigrants from Argentina (95.9%, a difference of 0.020%).
| Demographics | Rating | Rank | 7th Grade |
| Liberians | 32.5 /100 | #191 | Fair 95.9% |
| Panamanians | 32.3 /100 | #192 | Fair 95.9% |
| Immigrants | Bahamas | 30.8 /100 | #193 | Fair 95.9% |
| Immigrants | Nepal | 30.0 /100 | #194 | Fair 95.9% |
| Sudanese | 28.1 /100 | #195 | Fair 95.9% |
| Apache | 27.6 /100 | #196 | Fair 95.9% |
| Immigrants | Zaire | 26.7 /100 | #197 | Fair 95.9% |
| Paraguayans | 24.8 /100 | #198 | Fair 95.9% |
| Guamanians/Chamorros | 23.5 /100 | #199 | Fair 95.9% |
| Argentineans | 23.2 /100 | #200 | Fair 95.9% |
| Immigrants | Argentina | 21.9 /100 | #201 | Fair 95.9% |
| Immigrants | Northern Africa | 21.4 /100 | #202 | Fair 95.8% |
| Comanche | 21.1 /100 | #203 | Fair 95.8% |
| Assyrians/Chaldeans/Syriacs | 20.5 /100 | #204 | Fair 95.8% |
| Moroccans | 18.9 /100 | #205 | Poor 95.8% |