Indonesian vs Immigrants from Czechoslovakia 7th Grade
COMPARE
Indonesian
Immigrants from Czechoslovakia
7th Grade
7th Grade Comparison
Indonesians
Immigrants from Czechoslovakia
94.5%
7TH GRADE
0.0/ 100
METRIC RATING
298th/ 347
METRIC RANK
96.6%
7TH GRADE
98.3/ 100
METRIC RATING
102nd/ 347
METRIC RANK
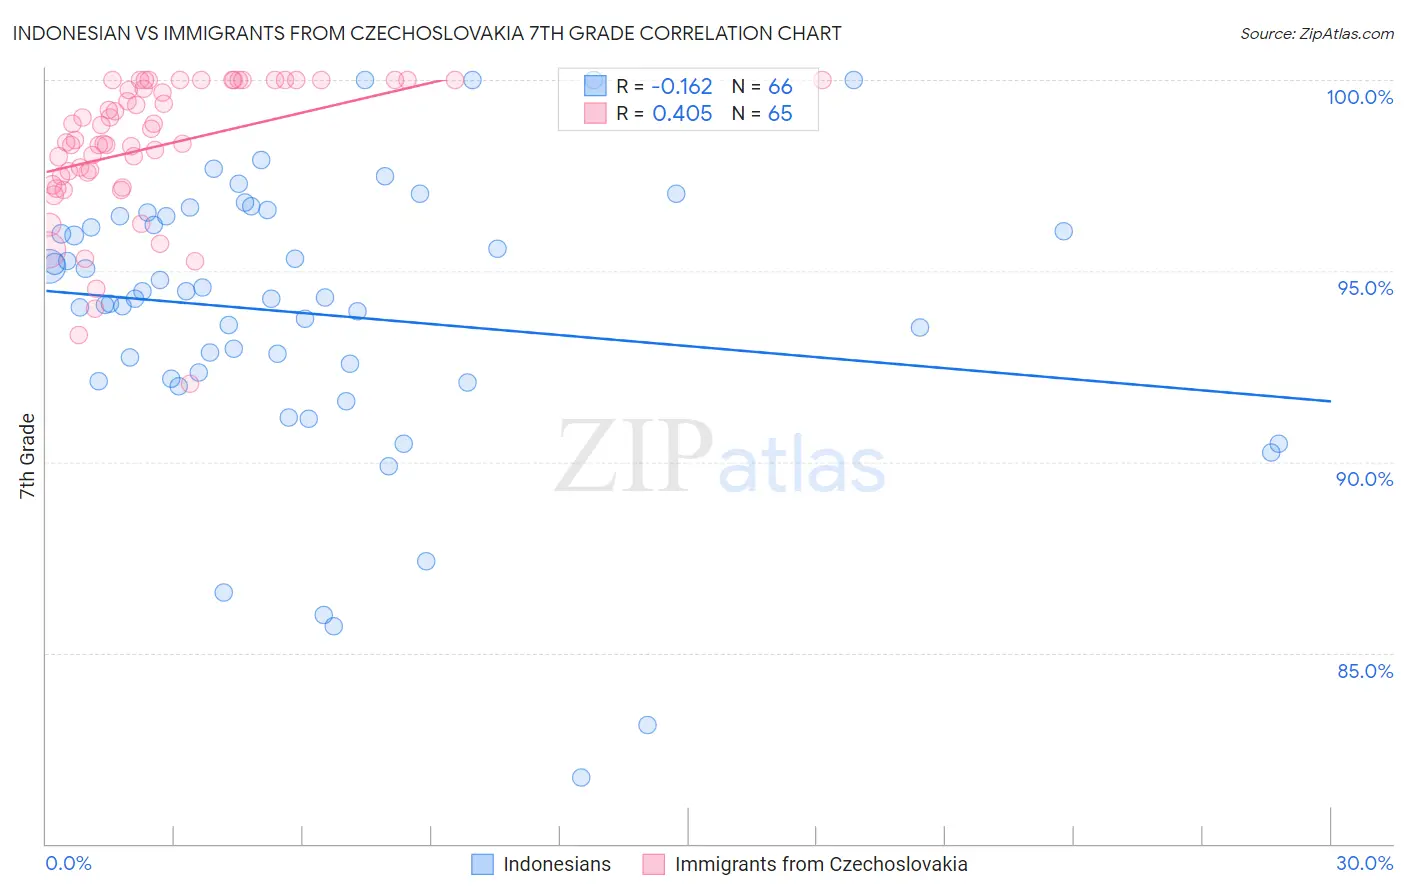
Indonesian vs Immigrants from Czechoslovakia 7th Grade Correlation Chart
The statistical analysis conducted on geographies consisting of 162,727,113 people shows a poor negative correlation between the proportion of Indonesians and percentage of population with at least 7th grade education in the United States with a correlation coefficient (R) of -0.162 and weighted average of 94.5%. Similarly, the statistical analysis conducted on geographies consisting of 195,448,106 people shows a moderate positive correlation between the proportion of Immigrants from Czechoslovakia and percentage of population with at least 7th grade education in the United States with a correlation coefficient (R) of 0.405 and weighted average of 96.6%, a difference of 2.2%.
7th Grade Correlation Summary
| Measurement | Indonesian | Immigrants from Czechoslovakia |
| Minimum | 81.7% | 92.0% |
| Maximum | 100.0% | 100.0% |
| Range | 18.3% | 8.0% |
| Mean | 93.9% | 98.3% |
| Median | 94.3% | 98.4% |
| Interquartile 25% (IQ1) | 92.2% | 97.4% |
| Interquartile 75% (IQ3) | 96.4% | 100.0% |
| Interquartile Range (IQR) | 4.3% | 2.6% |
| Standard Deviation (Sample) | 3.7% | 1.8% |
| Standard Deviation (Population) | 3.7% | 1.8% |
Similar Demographics by 7th Grade
Demographics Similar to Indonesians by 7th Grade
In terms of 7th grade, the demographic groups most similar to Indonesians are Immigrants from South Eastern Asia (94.5%, a difference of 0.0%), Bangladeshi (94.5%, a difference of 0.010%), Immigrants from Burma/Myanmar (94.5%, a difference of 0.040%), Immigrants from Dominica (94.5%, a difference of 0.070%), and Immigrants from Laos (94.5%, a difference of 0.070%).
| Demographics | Rating | Rank | 7th Grade |
| Immigrants | Grenada | 0.0 /100 | #291 | Tragic 94.8% |
| Immigrants | West Indies | 0.0 /100 | #292 | Tragic 94.8% |
| Fijians | 0.0 /100 | #293 | Tragic 94.7% |
| Haitians | 0.0 /100 | #294 | Tragic 94.7% |
| Yaqui | 0.0 /100 | #295 | Tragic 94.6% |
| Cubans | 0.0 /100 | #296 | Tragic 94.6% |
| Immigrants | South Eastern Asia | 0.0 /100 | #297 | Tragic 94.5% |
| Indonesians | 0.0 /100 | #298 | Tragic 94.5% |
| Bangladeshis | 0.0 /100 | #299 | Tragic 94.5% |
| Immigrants | Burma/Myanmar | 0.0 /100 | #300 | Tragic 94.5% |
| Immigrants | Dominica | 0.0 /100 | #301 | Tragic 94.5% |
| Immigrants | Laos | 0.0 /100 | #302 | Tragic 94.5% |
| Sri Lankans | 0.0 /100 | #303 | Tragic 94.4% |
| Immigrants | Haiti | 0.0 /100 | #304 | Tragic 94.3% |
| Guyanese | 0.0 /100 | #305 | Tragic 94.3% |
Demographics Similar to Immigrants from Czechoslovakia by 7th Grade
In terms of 7th grade, the demographic groups most similar to Immigrants from Czechoslovakia are Immigrants from Singapore (96.6%, a difference of 0.0%), Thai (96.7%, a difference of 0.020%), Shoshone (96.6%, a difference of 0.020%), Immigrants from Sweden (96.7%, a difference of 0.030%), and Menominee (96.7%, a difference of 0.030%).
| Demographics | Rating | Rank | 7th Grade |
| Immigrants | Australia | 98.8 /100 | #95 | Exceptional 96.7% |
| Immigrants | Denmark | 98.7 /100 | #96 | Exceptional 96.7% |
| Immigrants | Germany | 98.7 /100 | #97 | Exceptional 96.7% |
| Immigrants | Sweden | 98.7 /100 | #98 | Exceptional 96.7% |
| Menominee | 98.7 /100 | #99 | Exceptional 96.7% |
| German Russians | 98.6 /100 | #100 | Exceptional 96.7% |
| Thais | 98.6 /100 | #101 | Exceptional 96.7% |
| Immigrants | Czechoslovakia | 98.3 /100 | #102 | Exceptional 96.6% |
| Immigrants | Singapore | 98.3 /100 | #103 | Exceptional 96.6% |
| Shoshone | 98.1 /100 | #104 | Exceptional 96.6% |
| South Africans | 98.0 /100 | #105 | Exceptional 96.6% |
| Iroquois | 97.9 /100 | #106 | Exceptional 96.6% |
| Lumbee | 97.8 /100 | #107 | Exceptional 96.6% |
| Immigrants | Saudi Arabia | 97.8 /100 | #108 | Exceptional 96.6% |
| Bhutanese | 97.7 /100 | #109 | Exceptional 96.6% |