Immigrants vs Immigrants from Guyana 12th Grade, No Diploma
COMPARE
Immigrants
Immigrants from Guyana
12th Grade, No Diploma
12th Grade, No Diploma Comparison
Immigrants
Immigrants from Guyana
88.2%
12TH GRADE, NO DIPLOMA
0.0/ 100
METRIC RATING
295th/ 347
METRIC RANK
88.1%
12TH GRADE, NO DIPLOMA
0.0/ 100
METRIC RATING
300th/ 347
METRIC RANK
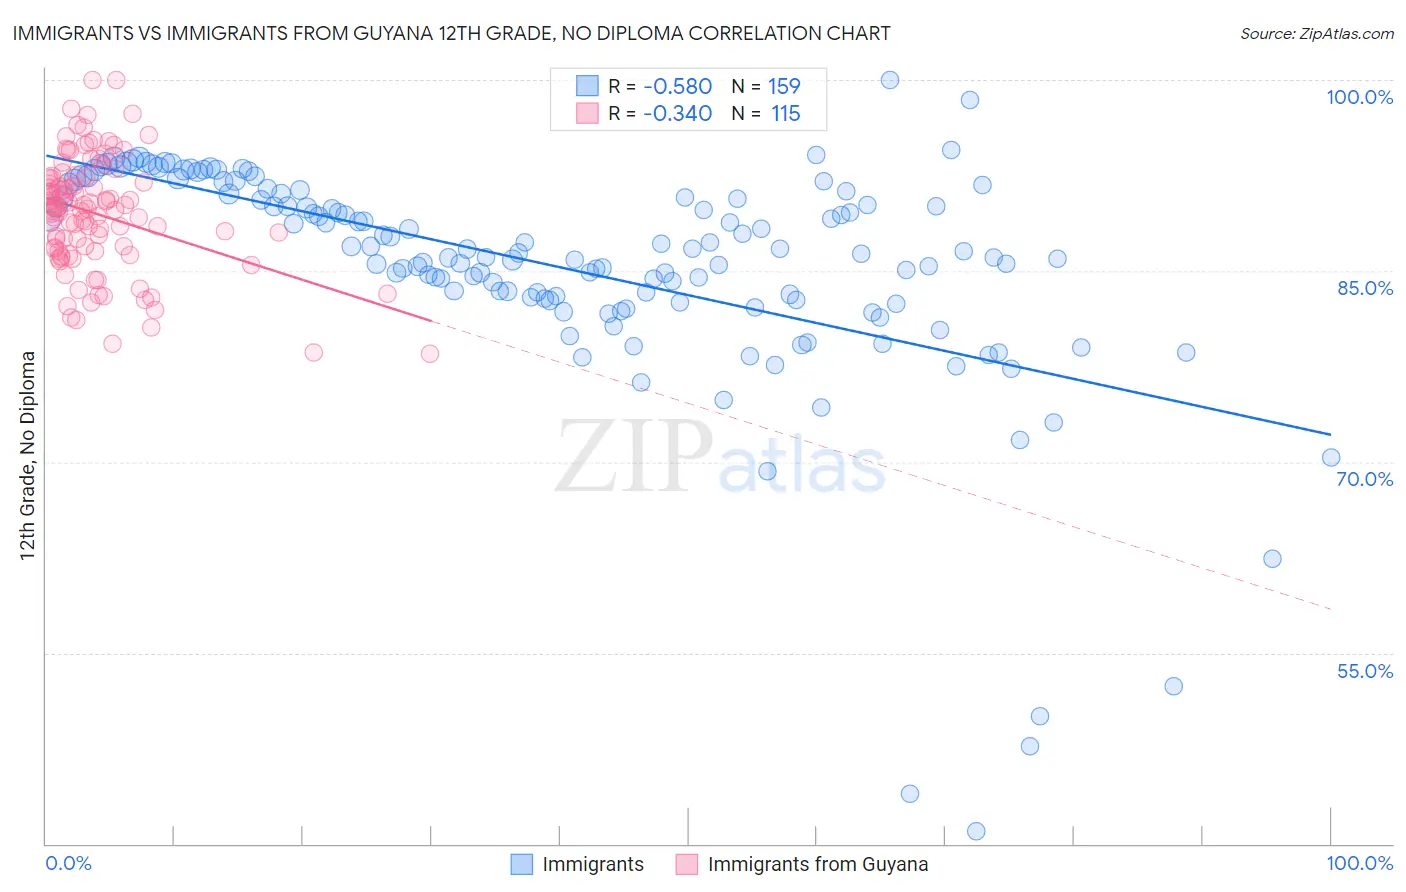
Immigrants vs Immigrants from Guyana 12th Grade, No Diploma Correlation Chart
The statistical analysis conducted on geographies consisting of 577,785,727 people shows a substantial negative correlation between the proportion of Immigrants and percentage of population with at least 12th grade (no diploma) education in the United States with a correlation coefficient (R) of -0.580 and weighted average of 88.2%. Similarly, the statistical analysis conducted on geographies consisting of 183,673,461 people shows a mild negative correlation between the proportion of Immigrants from Guyana and percentage of population with at least 12th grade (no diploma) education in the United States with a correlation coefficient (R) of -0.340 and weighted average of 88.1%, a difference of 0.17%.
12th Grade, No Diploma Correlation Summary
| Measurement | Immigrants | Immigrants from Guyana |
| Minimum | 41.0% | 78.5% |
| Maximum | 100.0% | 100.0% |
| Range | 59.0% | 21.5% |
| Mean | 85.2% | 89.5% |
| Median | 86.4% | 89.9% |
| Interquartile 25% (IQ1) | 82.7% | 86.6% |
| Interquartile 75% (IQ3) | 91.1% | 92.3% |
| Interquartile Range (IQR) | 8.4% | 5.7% |
| Standard Deviation (Sample) | 9.1% | 4.5% |
| Standard Deviation (Population) | 9.0% | 4.5% |
Demographics Similar to Immigrants and Immigrants from Guyana by 12th Grade, No Diploma
In terms of 12th grade, no diploma, the demographic groups most similar to Immigrants are Fijian (88.2%, a difference of 0.020%), Pueblo (88.2%, a difference of 0.030%), Guyanese (88.3%, a difference of 0.040%), Immigrants from Haiti (88.2%, a difference of 0.080%), and Japanese (88.3%, a difference of 0.11%). Similarly, the demographic groups most similar to Immigrants from Guyana are Immigrants from Cambodia (88.1%, a difference of 0.0%), Ecuadorian (88.0%, a difference of 0.030%), Nepalese (88.1%, a difference of 0.050%), Immigrants from Haiti (88.2%, a difference of 0.090%), and Immigrants from Bangladesh (88.0%, a difference of 0.13%).
| Demographics | Rating | Rank | 12th Grade, No Diploma |
| Hopi | 0.0 /100 | #287 | Tragic 88.6% |
| Immigrants | Fiji | 0.0 /100 | #288 | Tragic 88.6% |
| Dutch West Indians | 0.0 /100 | #289 | Tragic 88.5% |
| British West Indians | 0.0 /100 | #290 | Tragic 88.5% |
| Haitians | 0.0 /100 | #291 | Tragic 88.5% |
| Immigrants | Grenada | 0.0 /100 | #292 | Tragic 88.4% |
| Japanese | 0.0 /100 | #293 | Tragic 88.3% |
| Guyanese | 0.0 /100 | #294 | Tragic 88.3% |
| Immigrants | Immigrants | 0.0 /100 | #295 | Tragic 88.2% |
| Fijians | 0.0 /100 | #296 | Tragic 88.2% |
| Pueblo | 0.0 /100 | #297 | Tragic 88.2% |
| Immigrants | Haiti | 0.0 /100 | #298 | Tragic 88.2% |
| Nepalese | 0.0 /100 | #299 | Tragic 88.1% |
| Immigrants | Guyana | 0.0 /100 | #300 | Tragic 88.1% |
| Immigrants | Cambodia | 0.0 /100 | #301 | Tragic 88.1% |
| Ecuadorians | 0.0 /100 | #302 | Tragic 88.0% |
| Immigrants | Bangladesh | 0.0 /100 | #303 | Tragic 88.0% |
| Vietnamese | 0.0 /100 | #304 | Tragic 87.9% |
| Immigrants | Dominica | 0.0 /100 | #305 | Tragic 87.7% |
| Natives/Alaskans | 0.0 /100 | #306 | Tragic 87.7% |
| Immigrants | Portugal | 0.0 /100 | #307 | Tragic 87.6% |