Immigrants vs Immigrants from Congo 12th Grade, No Diploma
COMPARE
Immigrants
Immigrants from Congo
12th Grade, No Diploma
12th Grade, No Diploma Comparison
Immigrants
Immigrants from Congo
88.2%
12TH GRADE, NO DIPLOMA
0.0/ 100
METRIC RATING
295th/ 347
METRIC RANK
89.0%
12TH GRADE, NO DIPLOMA
0.1/ 100
METRIC RATING
275th/ 347
METRIC RANK
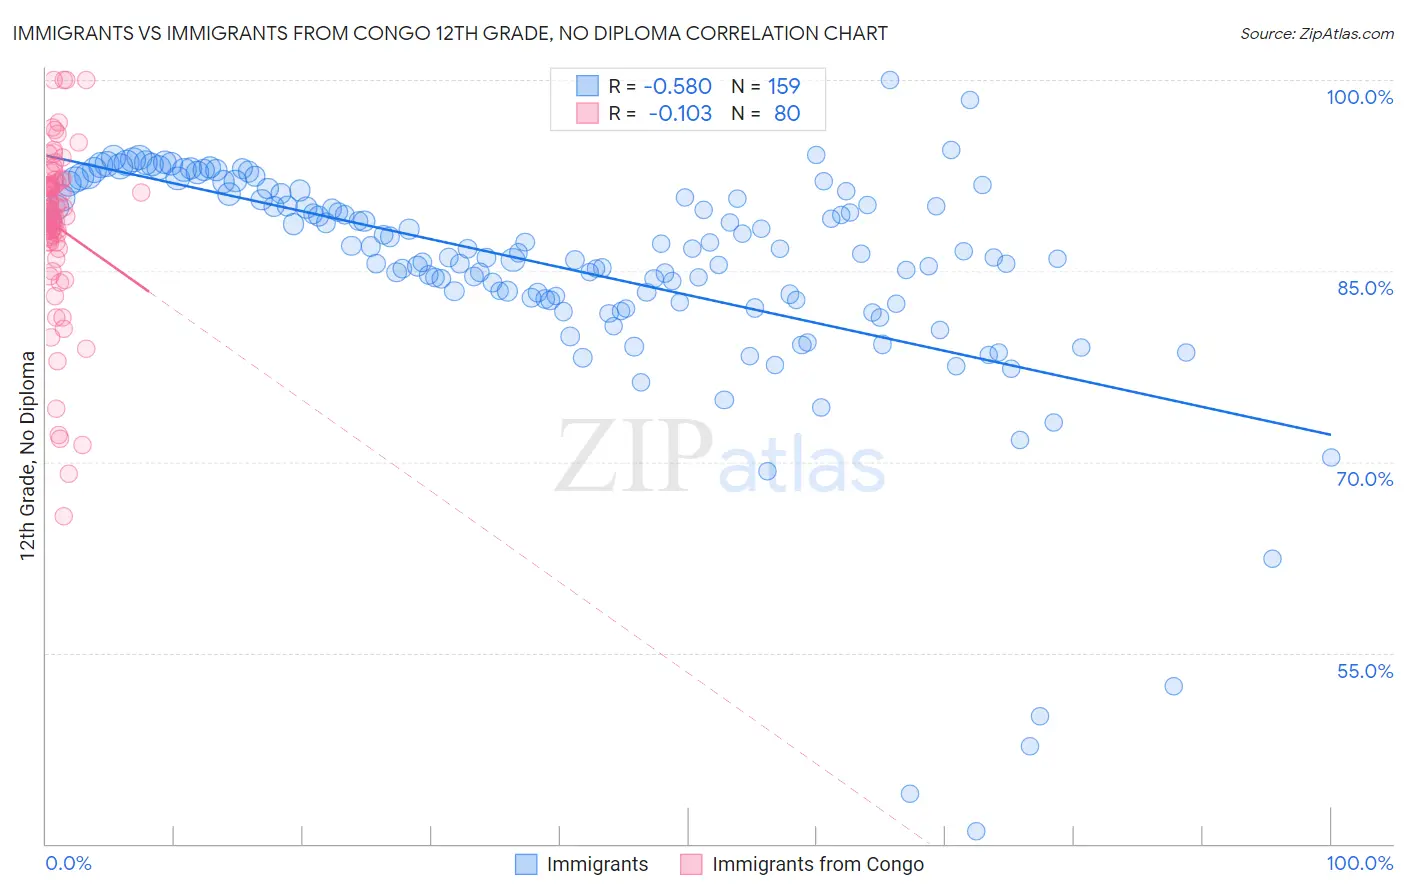
Immigrants vs Immigrants from Congo 12th Grade, No Diploma Correlation Chart
The statistical analysis conducted on geographies consisting of 577,785,727 people shows a substantial negative correlation between the proportion of Immigrants and percentage of population with at least 12th grade (no diploma) education in the United States with a correlation coefficient (R) of -0.580 and weighted average of 88.2%. Similarly, the statistical analysis conducted on geographies consisting of 92,134,351 people shows a poor negative correlation between the proportion of Immigrants from Congo and percentage of population with at least 12th grade (no diploma) education in the United States with a correlation coefficient (R) of -0.103 and weighted average of 89.0%, a difference of 0.94%.
12th Grade, No Diploma Correlation Summary
| Measurement | Immigrants | Immigrants from Congo |
| Minimum | 41.0% | 65.7% |
| Maximum | 100.0% | 100.0% |
| Range | 59.0% | 34.3% |
| Mean | 85.2% | 88.5% |
| Median | 86.4% | 89.7% |
| Interquartile 25% (IQ1) | 82.7% | 87.2% |
| Interquartile 75% (IQ3) | 91.1% | 92.0% |
| Interquartile Range (IQR) | 8.4% | 4.8% |
| Standard Deviation (Sample) | 9.1% | 6.8% |
| Standard Deviation (Population) | 9.0% | 6.8% |
Demographics Similar to Immigrants and Immigrants from Congo by 12th Grade, No Diploma
In terms of 12th grade, no diploma, the demographic groups most similar to Immigrants are Guyanese (88.3%, a difference of 0.040%), Japanese (88.3%, a difference of 0.11%), Immigrants from Grenada (88.4%, a difference of 0.19%), Haitian (88.5%, a difference of 0.36%), and Dutch West Indian (88.5%, a difference of 0.37%). Similarly, the demographic groups most similar to Immigrants from Congo are Ute (89.0%, a difference of 0.0%), Immigrants from Barbados (89.0%, a difference of 0.060%), Immigrants from St. Vincent and the Grenadines (88.9%, a difference of 0.12%), Immigrants from Laos (88.9%, a difference of 0.19%), and Immigrants from Burma/Myanmar (88.9%, a difference of 0.19%).
| Demographics | Rating | Rank | 12th Grade, No Diploma |
| Immigrants | Congo | 0.1 /100 | #275 | Tragic 89.0% |
| Ute | 0.1 /100 | #276 | Tragic 89.0% |
| Immigrants | Barbados | 0.0 /100 | #277 | Tragic 89.0% |
| Immigrants | St. Vincent and the Grenadines | 0.0 /100 | #278 | Tragic 88.9% |
| Immigrants | Laos | 0.0 /100 | #279 | Tragic 88.9% |
| Immigrants | Burma/Myanmar | 0.0 /100 | #280 | Tragic 88.9% |
| Cubans | 0.0 /100 | #281 | Tragic 88.9% |
| Immigrants | Vietnam | 0.0 /100 | #282 | Tragic 88.7% |
| Paiute | 0.0 /100 | #283 | Tragic 88.7% |
| Pennsylvania Germans | 0.0 /100 | #284 | Tragic 88.7% |
| Indonesians | 0.0 /100 | #285 | Tragic 88.6% |
| Immigrants | West Indies | 0.0 /100 | #286 | Tragic 88.6% |
| Hopi | 0.0 /100 | #287 | Tragic 88.6% |
| Immigrants | Fiji | 0.0 /100 | #288 | Tragic 88.6% |
| Dutch West Indians | 0.0 /100 | #289 | Tragic 88.5% |
| British West Indians | 0.0 /100 | #290 | Tragic 88.5% |
| Haitians | 0.0 /100 | #291 | Tragic 88.5% |
| Immigrants | Grenada | 0.0 /100 | #292 | Tragic 88.4% |
| Japanese | 0.0 /100 | #293 | Tragic 88.3% |
| Guyanese | 0.0 /100 | #294 | Tragic 88.3% |
| Immigrants | Immigrants | 0.0 /100 | #295 | Tragic 88.2% |