Immigrants vs Immigrants from Germany 8th Grade
COMPARE
Immigrants
Immigrants from Germany
8th Grade
8th Grade Comparison
Immigrants
Immigrants from Germany
93.6%
8TH GRADE
0.0/ 100
METRIC RATING
309th/ 347
METRIC RANK
96.4%
8TH GRADE
98.7/ 100
METRIC RATING
98th/ 347
METRIC RANK
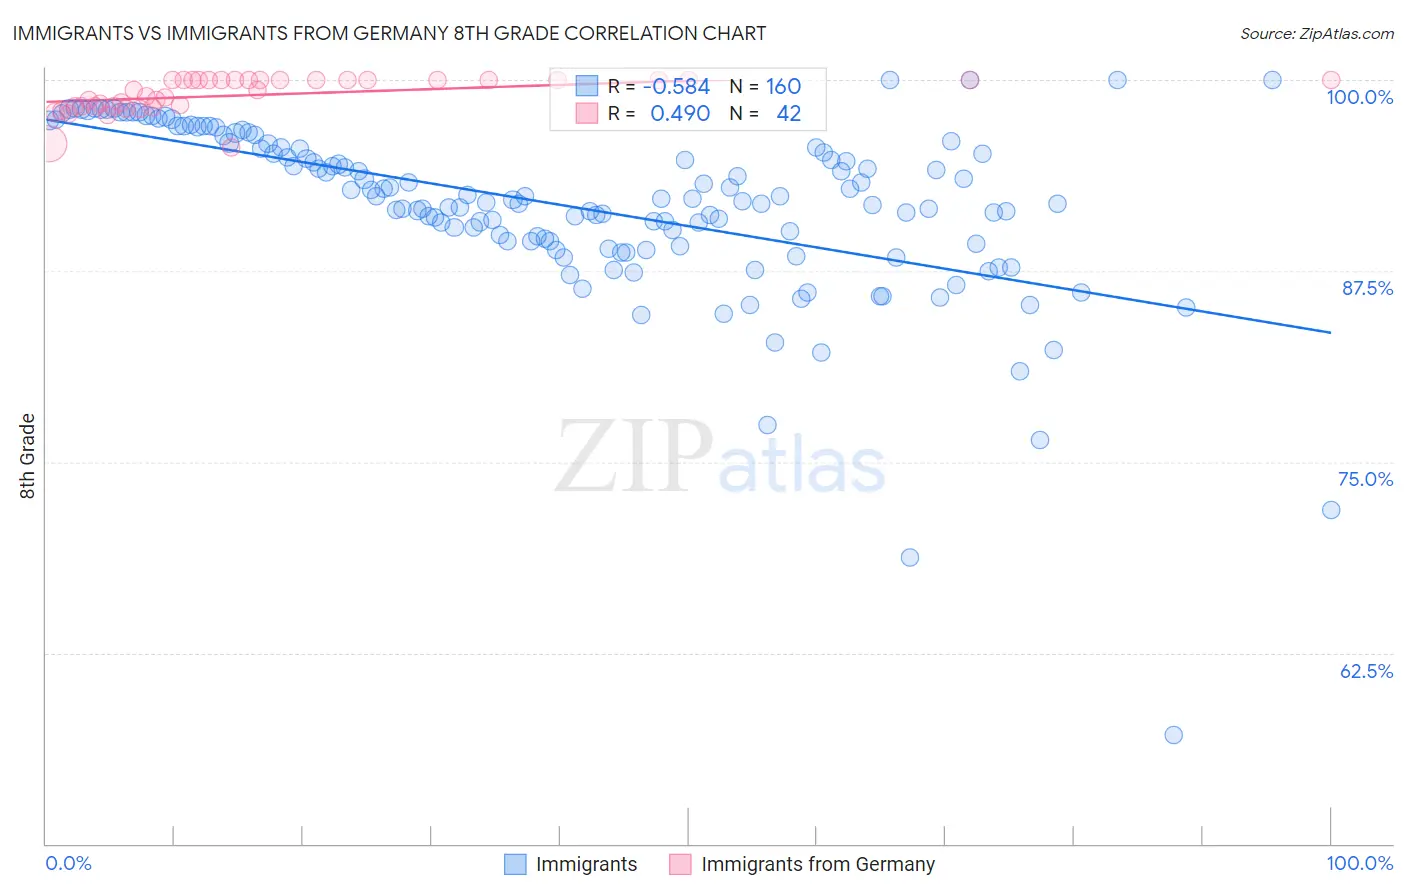
Immigrants vs Immigrants from Germany 8th Grade Correlation Chart
The statistical analysis conducted on geographies consisting of 577,787,160 people shows a substantial negative correlation between the proportion of Immigrants and percentage of population with at least 8th grade education in the United States with a correlation coefficient (R) of -0.584 and weighted average of 93.6%. Similarly, the statistical analysis conducted on geographies consisting of 463,886,845 people shows a moderate positive correlation between the proportion of Immigrants from Germany and percentage of population with at least 8th grade education in the United States with a correlation coefficient (R) of 0.490 and weighted average of 96.4%, a difference of 3.0%.
8th Grade Correlation Summary
| Measurement | Immigrants | Immigrants from Germany |
| Minimum | 57.2% | 95.6% |
| Maximum | 100.0% | 100.0% |
| Range | 42.8% | 4.4% |
| Mean | 91.8% | 99.0% |
| Median | 92.2% | 99.3% |
| Interquartile 25% (IQ1) | 89.4% | 98.3% |
| Interquartile 75% (IQ3) | 95.6% | 100.0% |
| Interquartile Range (IQR) | 6.1% | 1.7% |
| Standard Deviation (Sample) | 5.8% | 1.1% |
| Standard Deviation (Population) | 5.8% | 1.1% |
Similar Demographics by 8th Grade
Demographics Similar to Immigrants by 8th Grade
In terms of 8th grade, the demographic groups most similar to Immigrants are Japanese (93.6%, a difference of 0.0%), Immigrants from Bangladesh (93.6%, a difference of 0.010%), Ecuadorian (93.6%, a difference of 0.020%), Cape Verdean (93.5%, a difference of 0.050%), and Immigrants from Caribbean (93.5%, a difference of 0.070%).
| Demographics | Rating | Rank | 8th Grade |
| Sri Lankans | 0.0 /100 | #302 | Tragic 94.0% |
| Immigrants | Dominica | 0.0 /100 | #303 | Tragic 94.0% |
| Guyanese | 0.0 /100 | #304 | Tragic 93.9% |
| Immigrants | Haiti | 0.0 /100 | #305 | Tragic 93.9% |
| Immigrants | Guyana | 0.0 /100 | #306 | Tragic 93.8% |
| Immigrants | Portugal | 0.0 /100 | #307 | Tragic 93.8% |
| Ecuadorians | 0.0 /100 | #308 | Tragic 93.6% |
| Immigrants | Immigrants | 0.0 /100 | #309 | Tragic 93.6% |
| Japanese | 0.0 /100 | #310 | Tragic 93.6% |
| Immigrants | Bangladesh | 0.0 /100 | #311 | Tragic 93.6% |
| Cape Verdeans | 0.0 /100 | #312 | Tragic 93.5% |
| Immigrants | Caribbean | 0.0 /100 | #313 | Tragic 93.5% |
| Immigrants | Vietnam | 0.0 /100 | #314 | Tragic 93.5% |
| Vietnamese | 0.0 /100 | #315 | Tragic 93.5% |
| Immigrants | Cambodia | 0.0 /100 | #316 | Tragic 93.3% |
Demographics Similar to Immigrants from Germany by 8th Grade
In terms of 8th grade, the demographic groups most similar to Immigrants from Germany are Potawatomi (96.4%, a difference of 0.0%), Osage (96.4%, a difference of 0.0%), Cree (96.4%, a difference of 0.0%), Immigrants from Singapore (96.4%, a difference of 0.010%), and German Russian (96.4%, a difference of 0.010%).
| Demographics | Rating | Rank | 8th Grade |
| Thais | 98.9 /100 | #91 | Exceptional 96.4% |
| Menominee | 98.9 /100 | #92 | Exceptional 96.4% |
| Immigrants | Denmark | 98.8 /100 | #93 | Exceptional 96.4% |
| Immigrants | Singapore | 98.8 /100 | #94 | Exceptional 96.4% |
| German Russians | 98.8 /100 | #95 | Exceptional 96.4% |
| Potawatomi | 98.7 /100 | #96 | Exceptional 96.4% |
| Osage | 98.7 /100 | #97 | Exceptional 96.4% |
| Immigrants | Germany | 98.7 /100 | #98 | Exceptional 96.4% |
| Cree | 98.6 /100 | #99 | Exceptional 96.4% |
| Immigrants | Czechoslovakia | 98.6 /100 | #100 | Exceptional 96.4% |
| Bhutanese | 98.2 /100 | #101 | Exceptional 96.4% |
| South Africans | 98.2 /100 | #102 | Exceptional 96.4% |
| Immigrants | Saudi Arabia | 98.0 /100 | #103 | Exceptional 96.3% |
| Kiowa | 98.0 /100 | #104 | Exceptional 96.3% |
| Immigrants | North Macedonia | 98.0 /100 | #105 | Exceptional 96.3% |