Immigrants from Uzbekistan vs Cape Verdean Doctorate Degree
COMPARE
Immigrants from Uzbekistan
Cape Verdean
Doctorate Degree
Doctorate Degree Comparison
Immigrants from Uzbekistan
Cape Verdeans
2.0%
DOCTORATE DEGREE
89.3/ 100
METRIC RATING
133rd/ 347
METRIC RANK
1.4%
DOCTORATE DEGREE
0.3/ 100
METRIC RATING
289th/ 347
METRIC RANK
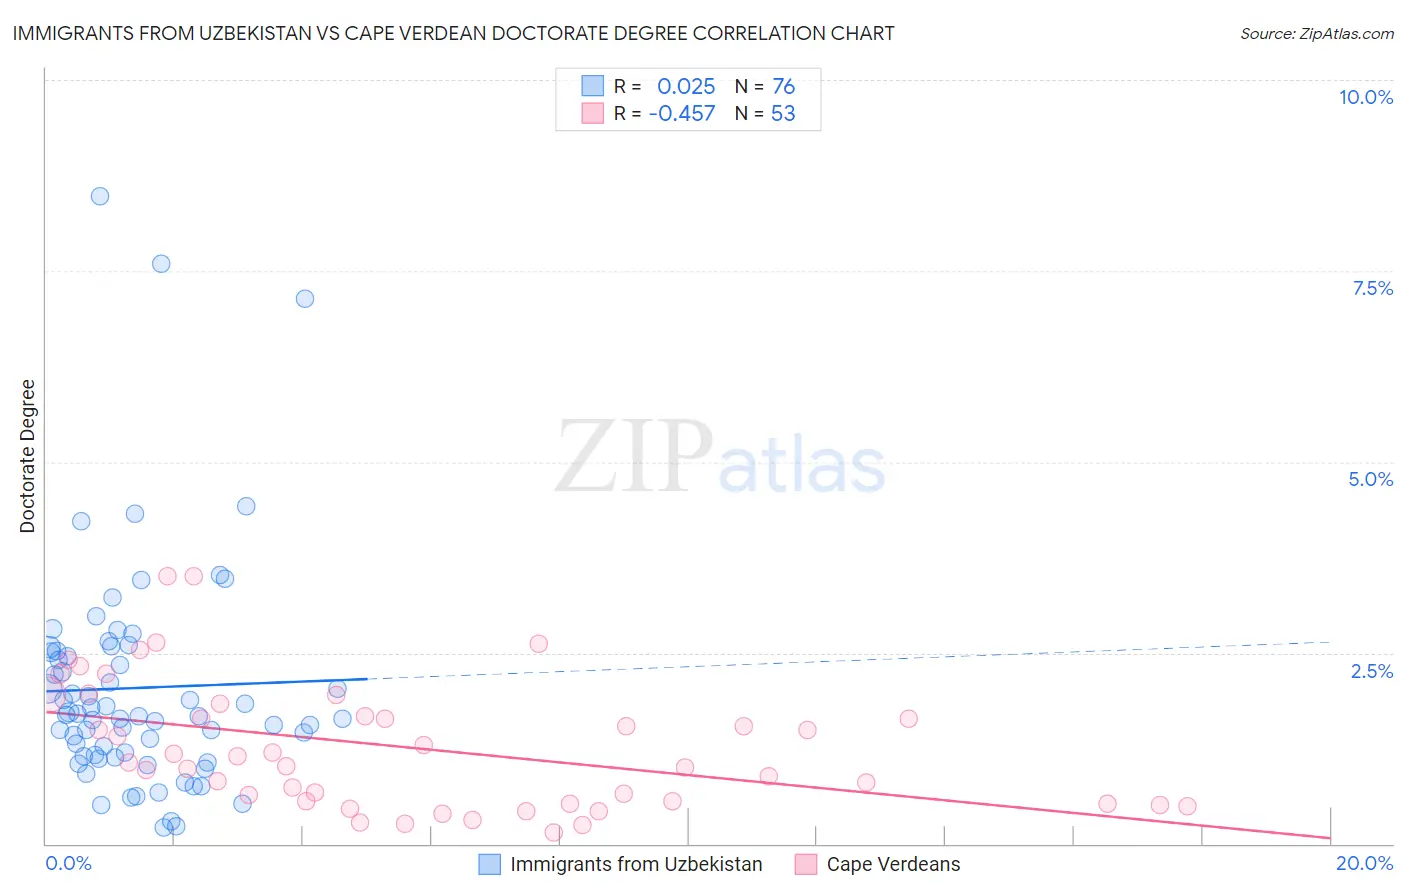
Immigrants from Uzbekistan vs Cape Verdean Doctorate Degree Correlation Chart
The statistical analysis conducted on geographies consisting of 118,602,748 people shows no correlation between the proportion of Immigrants from Uzbekistan and percentage of population with at least doctorate degree education in the United States with a correlation coefficient (R) of 0.025 and weighted average of 2.0%. Similarly, the statistical analysis conducted on geographies consisting of 107,405,258 people shows a moderate negative correlation between the proportion of Cape Verdeans and percentage of population with at least doctorate degree education in the United States with a correlation coefficient (R) of -0.457 and weighted average of 1.4%, a difference of 37.0%.
Doctorate Degree Correlation Summary
| Measurement | Immigrants from Uzbekistan | Cape Verdean |
| Minimum | 0.21% | 0.14% |
| Maximum | 8.5% | 3.5% |
| Range | 8.3% | 3.4% |
| Mean | 2.0% | 1.3% |
| Median | 1.7% | 1.1% |
| Interquartile 25% (IQ1) | 1.1% | 0.54% |
| Interquartile 75% (IQ3) | 2.5% | 1.7% |
| Interquartile Range (IQR) | 1.4% | 1.2% |
| Standard Deviation (Sample) | 1.5% | 0.83% |
| Standard Deviation (Population) | 1.5% | 0.82% |
Similar Demographics by Doctorate Degree
Demographics Similar to Immigrants from Uzbekistan by Doctorate Degree
In terms of doctorate degree, the demographic groups most similar to Immigrants from Uzbekistan are Scottish (2.0%, a difference of 0.050%), Immigrants from Cameroon (2.0%, a difference of 0.15%), Serbian (2.0%, a difference of 0.21%), Immigrants from Sierra Leone (2.0%, a difference of 0.33%), and Swedish (2.0%, a difference of 0.36%).
| Demographics | Rating | Rank | Doctorate Degree |
| Jordanians | 92.1 /100 | #126 | Exceptional 2.0% |
| Palestinians | 92.0 /100 | #127 | Exceptional 2.0% |
| Immigrants | Zaire | 91.1 /100 | #128 | Exceptional 2.0% |
| Canadians | 90.6 /100 | #129 | Exceptional 2.0% |
| Immigrants | Ukraine | 90.5 /100 | #130 | Exceptional 2.0% |
| Immigrants | Sierra Leone | 90.2 /100 | #131 | Exceptional 2.0% |
| Scottish | 89.4 /100 | #132 | Excellent 2.0% |
| Immigrants | Uzbekistan | 89.3 /100 | #133 | Excellent 2.0% |
| Immigrants | Cameroon | 88.9 /100 | #134 | Excellent 2.0% |
| Serbians | 88.7 /100 | #135 | Excellent 2.0% |
| Swedes | 88.3 /100 | #136 | Excellent 2.0% |
| South American Indians | 88.3 /100 | #137 | Excellent 2.0% |
| Swiss | 88.0 /100 | #138 | Excellent 2.0% |
| Afghans | 87.2 /100 | #139 | Excellent 2.0% |
| Immigrants | Africa | 87.0 /100 | #140 | Excellent 2.0% |
Demographics Similar to Cape Verdeans by Doctorate Degree
In terms of doctorate degree, the demographic groups most similar to Cape Verdeans are Choctaw (1.4%, a difference of 0.020%), Immigrants from El Salvador (1.4%, a difference of 0.14%), Black/African American (1.4%, a difference of 0.24%), Cajun (1.5%, a difference of 0.31%), and Alaska Native (1.4%, a difference of 0.42%).
| Demographics | Rating | Rank | Doctorate Degree |
| British West Indians | 0.3 /100 | #282 | Tragic 1.5% |
| Central Americans | 0.3 /100 | #283 | Tragic 1.5% |
| Jamaicans | 0.3 /100 | #284 | Tragic 1.5% |
| Malaysians | 0.3 /100 | #285 | Tragic 1.5% |
| Cherokee | 0.3 /100 | #286 | Tragic 1.5% |
| Cajuns | 0.3 /100 | #287 | Tragic 1.5% |
| Immigrants | El Salvador | 0.3 /100 | #288 | Tragic 1.4% |
| Cape Verdeans | 0.3 /100 | #289 | Tragic 1.4% |
| Choctaw | 0.3 /100 | #290 | Tragic 1.4% |
| Blacks/African Americans | 0.3 /100 | #291 | Tragic 1.4% |
| Alaska Natives | 0.3 /100 | #292 | Tragic 1.4% |
| Immigrants | Yemen | 0.2 /100 | #293 | Tragic 1.4% |
| Samoans | 0.2 /100 | #294 | Tragic 1.4% |
| Guatemalans | 0.2 /100 | #295 | Tragic 1.4% |
| Immigrants | Ecuador | 0.2 /100 | #296 | Tragic 1.4% |