Immigrants from Europe vs Cape Verdean Doctorate Degree
COMPARE
Immigrants from Europe
Cape Verdean
Doctorate Degree
Doctorate Degree Comparison
Immigrants from Europe
Cape Verdeans
2.3%
DOCTORATE DEGREE
99.9/ 100
METRIC RATING
62nd/ 347
METRIC RANK
1.4%
DOCTORATE DEGREE
0.3/ 100
METRIC RATING
289th/ 347
METRIC RANK
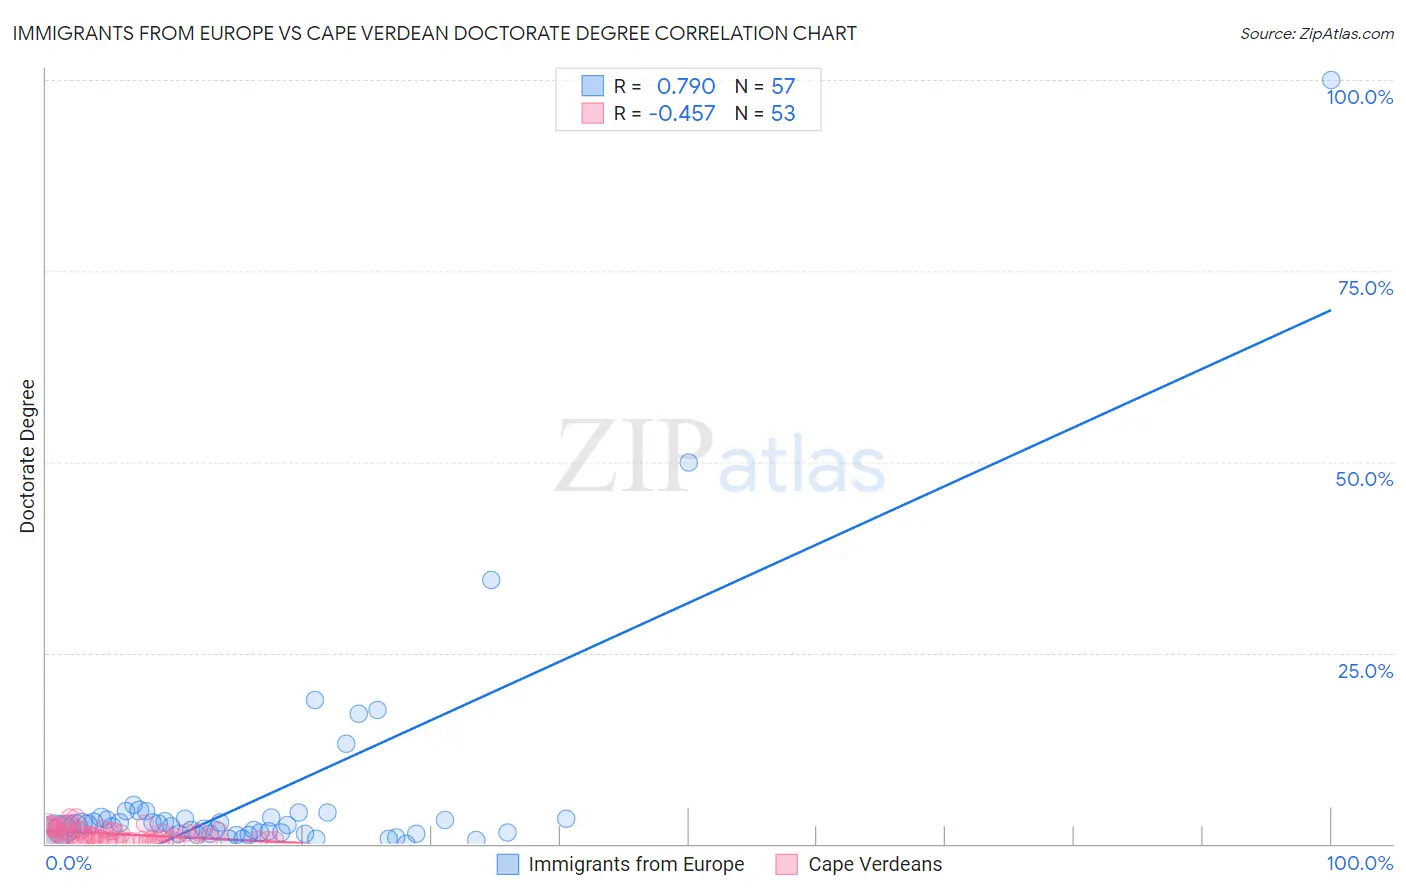
Immigrants from Europe vs Cape Verdean Doctorate Degree Correlation Chart
The statistical analysis conducted on geographies consisting of 532,096,533 people shows a strong positive correlation between the proportion of Immigrants from Europe and percentage of population with at least doctorate degree education in the United States with a correlation coefficient (R) of 0.790 and weighted average of 2.3%. Similarly, the statistical analysis conducted on geographies consisting of 107,405,258 people shows a moderate negative correlation between the proportion of Cape Verdeans and percentage of population with at least doctorate degree education in the United States with a correlation coefficient (R) of -0.457 and weighted average of 1.4%, a difference of 59.7%.
Doctorate Degree Correlation Summary
| Measurement | Immigrants from Europe | Cape Verdean |
| Minimum | 0.013% | 0.14% |
| Maximum | 100.0% | 3.5% |
| Range | 100.0% | 3.4% |
| Mean | 6.3% | 1.3% |
| Median | 2.4% | 1.1% |
| Interquartile 25% (IQ1) | 1.4% | 0.54% |
| Interquartile 75% (IQ3) | 3.4% | 1.7% |
| Interquartile Range (IQR) | 2.0% | 1.2% |
| Standard Deviation (Sample) | 15.1% | 0.83% |
| Standard Deviation (Population) | 15.0% | 0.82% |
Similar Demographics by Doctorate Degree
Demographics Similar to Immigrants from Europe by Doctorate Degree
In terms of doctorate degree, the demographic groups most similar to Immigrants from Europe are Laotian (2.3%, a difference of 0.090%), Immigrants from Greece (2.3%, a difference of 0.49%), Bhutanese (2.3%, a difference of 0.52%), Paraguayan (2.3%, a difference of 1.0%), and Argentinean (2.3%, a difference of 1.2%).
| Demographics | Rating | Rank | Doctorate Degree |
| Bolivians | 100.0 /100 | #55 | Exceptional 2.4% |
| Immigrants | Czechoslovakia | 100.0 /100 | #56 | Exceptional 2.4% |
| Immigrants | Ethiopia | 100.0 /100 | #57 | Exceptional 2.4% |
| Ethiopians | 99.9 /100 | #58 | Exceptional 2.3% |
| South Africans | 99.9 /100 | #59 | Exceptional 2.3% |
| Immigrants | Serbia | 99.9 /100 | #60 | Exceptional 2.3% |
| Bhutanese | 99.9 /100 | #61 | Exceptional 2.3% |
| Immigrants | Europe | 99.9 /100 | #62 | Exceptional 2.3% |
| Laotians | 99.9 /100 | #63 | Exceptional 2.3% |
| Immigrants | Greece | 99.9 /100 | #64 | Exceptional 2.3% |
| Paraguayans | 99.9 /100 | #65 | Exceptional 2.3% |
| Argentineans | 99.9 /100 | #66 | Exceptional 2.3% |
| Zimbabweans | 99.8 /100 | #67 | Exceptional 2.3% |
| Immigrants | Kazakhstan | 99.8 /100 | #68 | Exceptional 2.3% |
| Carpatho Rusyns | 99.8 /100 | #69 | Exceptional 2.3% |
Demographics Similar to Cape Verdeans by Doctorate Degree
In terms of doctorate degree, the demographic groups most similar to Cape Verdeans are Choctaw (1.4%, a difference of 0.020%), Immigrants from El Salvador (1.4%, a difference of 0.14%), Black/African American (1.4%, a difference of 0.24%), Cajun (1.5%, a difference of 0.31%), and Alaska Native (1.4%, a difference of 0.42%).
| Demographics | Rating | Rank | Doctorate Degree |
| British West Indians | 0.3 /100 | #282 | Tragic 1.5% |
| Central Americans | 0.3 /100 | #283 | Tragic 1.5% |
| Jamaicans | 0.3 /100 | #284 | Tragic 1.5% |
| Malaysians | 0.3 /100 | #285 | Tragic 1.5% |
| Cherokee | 0.3 /100 | #286 | Tragic 1.5% |
| Cajuns | 0.3 /100 | #287 | Tragic 1.5% |
| Immigrants | El Salvador | 0.3 /100 | #288 | Tragic 1.4% |
| Cape Verdeans | 0.3 /100 | #289 | Tragic 1.4% |
| Choctaw | 0.3 /100 | #290 | Tragic 1.4% |
| Blacks/African Americans | 0.3 /100 | #291 | Tragic 1.4% |
| Alaska Natives | 0.3 /100 | #292 | Tragic 1.4% |
| Immigrants | Yemen | 0.2 /100 | #293 | Tragic 1.4% |
| Samoans | 0.2 /100 | #294 | Tragic 1.4% |
| Guatemalans | 0.2 /100 | #295 | Tragic 1.4% |
| Immigrants | Ecuador | 0.2 /100 | #296 | Tragic 1.4% |