Immigrants from Uruguay vs Lithuanian 7th Grade
COMPARE
Immigrants from Uruguay
Lithuanian
7th Grade
7th Grade Comparison
Immigrants from Uruguay
Lithuanians
95.2%
7TH GRADE
0.3/ 100
METRIC RATING
265th/ 347
METRIC RANK
97.5%
7TH GRADE
100.0/ 100
METRIC RATING
19th/ 347
METRIC RANK
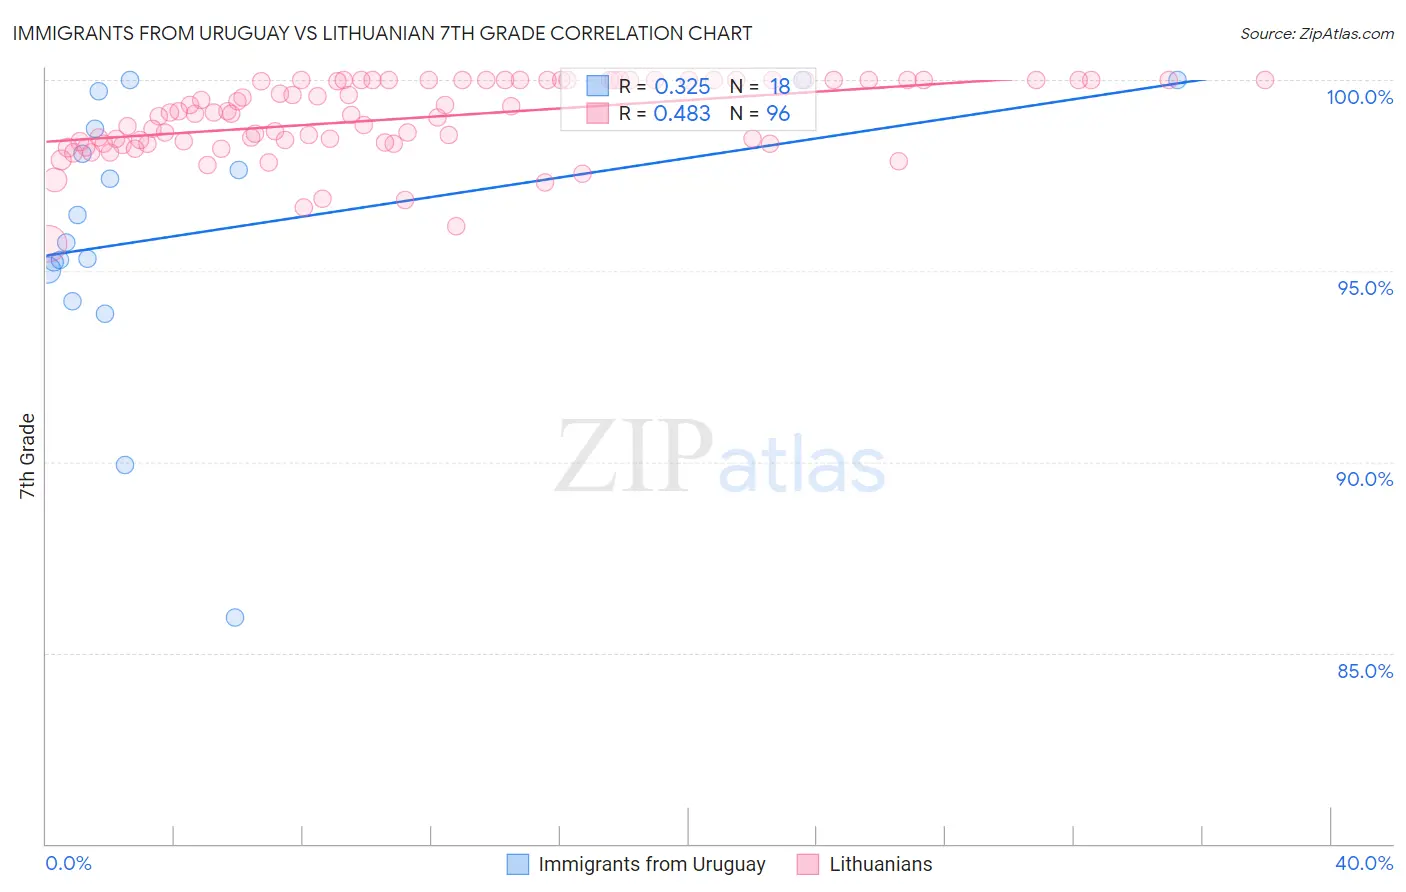
Immigrants from Uruguay vs Lithuanian 7th Grade Correlation Chart
The statistical analysis conducted on geographies consisting of 133,259,667 people shows a mild positive correlation between the proportion of Immigrants from Uruguay and percentage of population with at least 7th grade education in the United States with a correlation coefficient (R) of 0.325 and weighted average of 95.2%. Similarly, the statistical analysis conducted on geographies consisting of 421,947,029 people shows a moderate positive correlation between the proportion of Lithuanians and percentage of population with at least 7th grade education in the United States with a correlation coefficient (R) of 0.483 and weighted average of 97.5%, a difference of 2.4%.
7th Grade Correlation Summary
| Measurement | Immigrants from Uruguay | Lithuanian |
| Minimum | 85.9% | 95.7% |
| Maximum | 100.0% | 100.0% |
| Range | 14.1% | 4.3% |
| Mean | 96.0% | 99.0% |
| Median | 96.1% | 99.1% |
| Interquartile 25% (IQ1) | 95.0% | 98.4% |
| Interquartile 75% (IQ3) | 98.7% | 100.0% |
| Interquartile Range (IQR) | 3.7% | 1.6% |
| Standard Deviation (Sample) | 3.7% | 1.00% |
| Standard Deviation (Population) | 3.6% | 0.99% |
Similar Demographics by 7th Grade
Demographics Similar to Immigrants from Uruguay by 7th Grade
In terms of 7th grade, the demographic groups most similar to Immigrants from Uruguay are Immigrants from Ghana (95.2%, a difference of 0.0%), Yuman (95.2%, a difference of 0.020%), Immigrants from Hong Kong (95.2%, a difference of 0.020%), Immigrants from Nigeria (95.2%, a difference of 0.030%), and South American (95.2%, a difference of 0.050%).
| Demographics | Rating | Rank | 7th Grade |
| Ghanaians | 0.7 /100 | #258 | Tragic 95.3% |
| Immigrants | Costa Rica | 0.6 /100 | #259 | Tragic 95.3% |
| Afghans | 0.5 /100 | #260 | Tragic 95.3% |
| South Americans | 0.5 /100 | #261 | Tragic 95.2% |
| Immigrants | Somalia | 0.5 /100 | #262 | Tragic 95.2% |
| West Indians | 0.5 /100 | #263 | Tragic 95.2% |
| Immigrants | Nigeria | 0.4 /100 | #264 | Tragic 95.2% |
| Immigrants | Uruguay | 0.3 /100 | #265 | Tragic 95.2% |
| Immigrants | Ghana | 0.3 /100 | #266 | Tragic 95.2% |
| Yuman | 0.3 /100 | #267 | Tragic 95.2% |
| Immigrants | Hong Kong | 0.3 /100 | #268 | Tragic 95.2% |
| Trinidadians and Tobagonians | 0.3 /100 | #269 | Tragic 95.2% |
| Houma | 0.2 /100 | #270 | Tragic 95.1% |
| Immigrants | South America | 0.2 /100 | #271 | Tragic 95.1% |
| Peruvians | 0.2 /100 | #272 | Tragic 95.1% |
Demographics Similar to Lithuanians by 7th Grade
In terms of 7th grade, the demographic groups most similar to Lithuanians are Tlingit-Haida (97.5%, a difference of 0.010%), Scottish (97.5%, a difference of 0.020%), Irish (97.5%, a difference of 0.030%), Yup'ik (97.4%, a difference of 0.040%), and Inupiat (97.4%, a difference of 0.060%).
| Demographics | Rating | Rank | 7th Grade |
| Poles | 100.0 /100 | #12 | Exceptional 97.6% |
| Swedes | 100.0 /100 | #13 | Exceptional 97.6% |
| Pennsylvania Germans | 100.0 /100 | #14 | Exceptional 97.6% |
| English | 100.0 /100 | #15 | Exceptional 97.6% |
| Irish | 100.0 /100 | #16 | Exceptional 97.5% |
| Scottish | 100.0 /100 | #17 | Exceptional 97.5% |
| Tlingit-Haida | 100.0 /100 | #18 | Exceptional 97.5% |
| Lithuanians | 100.0 /100 | #19 | Exceptional 97.5% |
| Yup'ik | 100.0 /100 | #20 | Exceptional 97.4% |
| Inupiat | 100.0 /100 | #21 | Exceptional 97.4% |
| French Canadians | 100.0 /100 | #22 | Exceptional 97.4% |
| Croatians | 100.0 /100 | #23 | Exceptional 97.4% |
| Welsh | 100.0 /100 | #24 | Exceptional 97.4% |
| French | 100.0 /100 | #25 | Exceptional 97.4% |
| Scotch-Irish | 100.0 /100 | #26 | Exceptional 97.4% |