Cape Verdean vs Lithuanian 7th Grade
COMPARE
Cape Verdean
Lithuanian
7th Grade
7th Grade Comparison
Cape Verdeans
Lithuanians
94.1%
7TH GRADE
0.0/ 100
METRIC RATING
308th/ 347
METRIC RANK
97.5%
7TH GRADE
100.0/ 100
METRIC RATING
19th/ 347
METRIC RANK
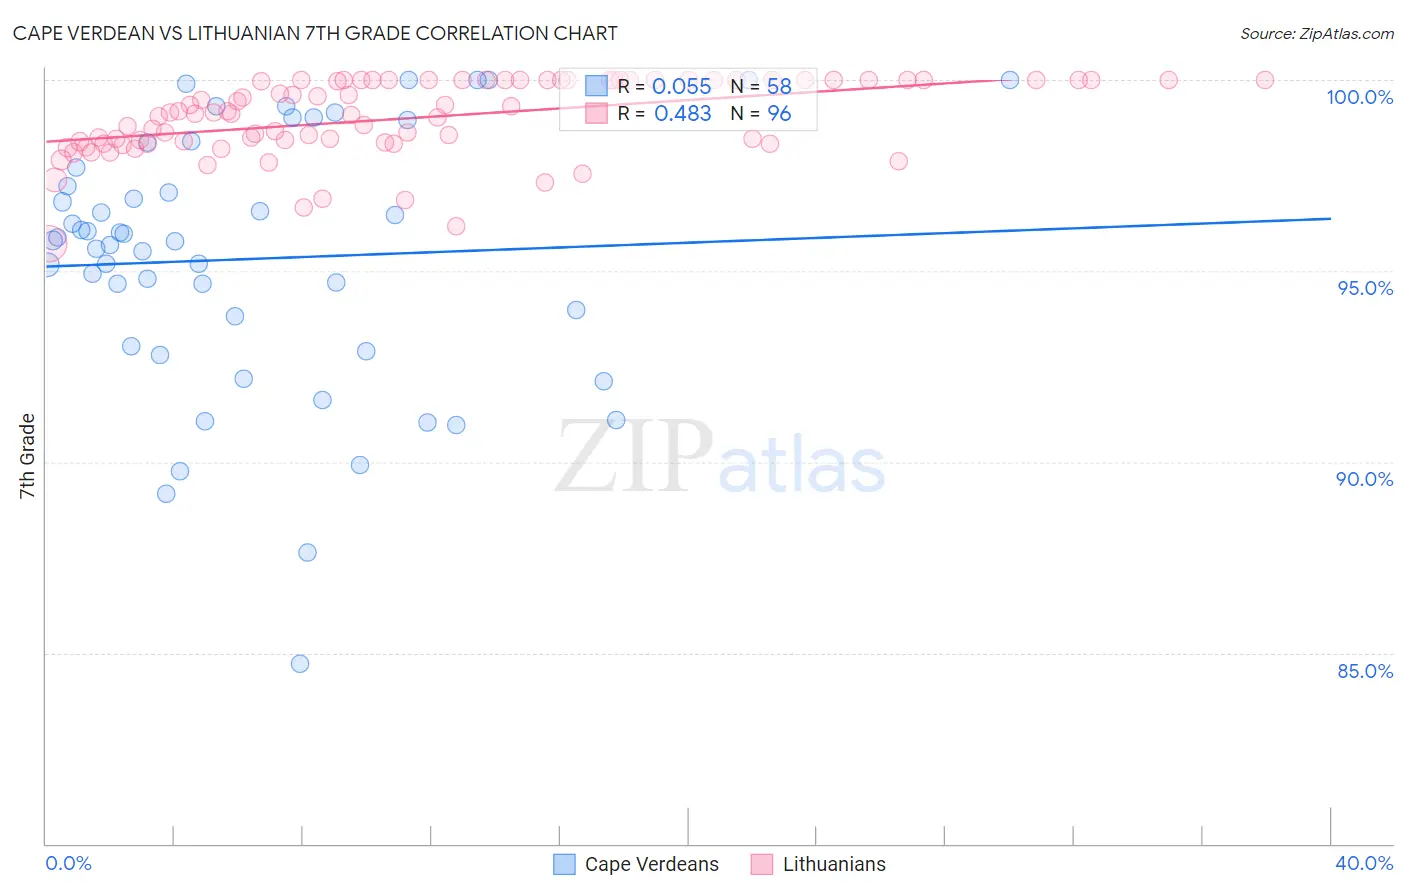
Cape Verdean vs Lithuanian 7th Grade Correlation Chart
The statistical analysis conducted on geographies consisting of 107,537,955 people shows a slight positive correlation between the proportion of Cape Verdeans and percentage of population with at least 7th grade education in the United States with a correlation coefficient (R) of 0.055 and weighted average of 94.1%. Similarly, the statistical analysis conducted on geographies consisting of 421,947,029 people shows a moderate positive correlation between the proportion of Lithuanians and percentage of population with at least 7th grade education in the United States with a correlation coefficient (R) of 0.483 and weighted average of 97.5%, a difference of 3.6%.
7th Grade Correlation Summary
| Measurement | Cape Verdean | Lithuanian |
| Minimum | 84.7% | 95.7% |
| Maximum | 100.0% | 100.0% |
| Range | 15.3% | 4.3% |
| Mean | 95.3% | 99.0% |
| Median | 95.8% | 99.1% |
| Interquartile 25% (IQ1) | 93.0% | 98.4% |
| Interquartile 75% (IQ3) | 97.7% | 100.0% |
| Interquartile Range (IQR) | 4.7% | 1.6% |
| Standard Deviation (Sample) | 3.4% | 1.00% |
| Standard Deviation (Population) | 3.4% | 0.99% |
Similar Demographics by 7th Grade
Demographics Similar to Cape Verdeans by 7th Grade
In terms of 7th grade, the demographic groups most similar to Cape Verdeans are Ecuadorian (94.0%, a difference of 0.060%), Immigrants from Caribbean (94.0%, a difference of 0.070%), Immigrants from Portugal (94.2%, a difference of 0.080%), Puerto Rican (94.0%, a difference of 0.080%), and Immigrants from Guyana (94.2%, a difference of 0.10%).
| Demographics | Rating | Rank | 7th Grade |
| Immigrants | Dominica | 0.0 /100 | #301 | Tragic 94.5% |
| Immigrants | Laos | 0.0 /100 | #302 | Tragic 94.5% |
| Sri Lankans | 0.0 /100 | #303 | Tragic 94.4% |
| Immigrants | Haiti | 0.0 /100 | #304 | Tragic 94.3% |
| Guyanese | 0.0 /100 | #305 | Tragic 94.3% |
| Immigrants | Guyana | 0.0 /100 | #306 | Tragic 94.2% |
| Immigrants | Portugal | 0.0 /100 | #307 | Tragic 94.2% |
| Cape Verdeans | 0.0 /100 | #308 | Tragic 94.1% |
| Ecuadorians | 0.0 /100 | #309 | Tragic 94.0% |
| Immigrants | Caribbean | 0.0 /100 | #310 | Tragic 94.0% |
| Puerto Ricans | 0.0 /100 | #311 | Tragic 94.0% |
| Immigrants | Immigrants | 0.0 /100 | #312 | Tragic 94.0% |
| Immigrants | Bangladesh | 0.0 /100 | #313 | Tragic 94.0% |
| Japanese | 0.0 /100 | #314 | Tragic 94.0% |
| Vietnamese | 0.0 /100 | #315 | Tragic 93.9% |
Demographics Similar to Lithuanians by 7th Grade
In terms of 7th grade, the demographic groups most similar to Lithuanians are Tlingit-Haida (97.5%, a difference of 0.010%), Scottish (97.5%, a difference of 0.020%), Irish (97.5%, a difference of 0.030%), Yup'ik (97.4%, a difference of 0.040%), and Inupiat (97.4%, a difference of 0.060%).
| Demographics | Rating | Rank | 7th Grade |
| Poles | 100.0 /100 | #12 | Exceptional 97.6% |
| Swedes | 100.0 /100 | #13 | Exceptional 97.6% |
| Pennsylvania Germans | 100.0 /100 | #14 | Exceptional 97.6% |
| English | 100.0 /100 | #15 | Exceptional 97.6% |
| Irish | 100.0 /100 | #16 | Exceptional 97.5% |
| Scottish | 100.0 /100 | #17 | Exceptional 97.5% |
| Tlingit-Haida | 100.0 /100 | #18 | Exceptional 97.5% |
| Lithuanians | 100.0 /100 | #19 | Exceptional 97.5% |
| Yup'ik | 100.0 /100 | #20 | Exceptional 97.4% |
| Inupiat | 100.0 /100 | #21 | Exceptional 97.4% |
| French Canadians | 100.0 /100 | #22 | Exceptional 97.4% |
| Croatians | 100.0 /100 | #23 | Exceptional 97.4% |
| Welsh | 100.0 /100 | #24 | Exceptional 97.4% |
| French | 100.0 /100 | #25 | Exceptional 97.4% |
| Scotch-Irish | 100.0 /100 | #26 | Exceptional 97.4% |