Immigrants from Thailand vs Guyanese 5th Grade
COMPARE
Immigrants from Thailand
Guyanese
5th Grade
5th Grade Comparison
Immigrants from Thailand
Guyanese
96.6%
5TH GRADE
0.1/ 100
METRIC RATING
286th/ 347
METRIC RANK
96.1%
5TH GRADE
0.0/ 100
METRIC RATING
302nd/ 347
METRIC RANK
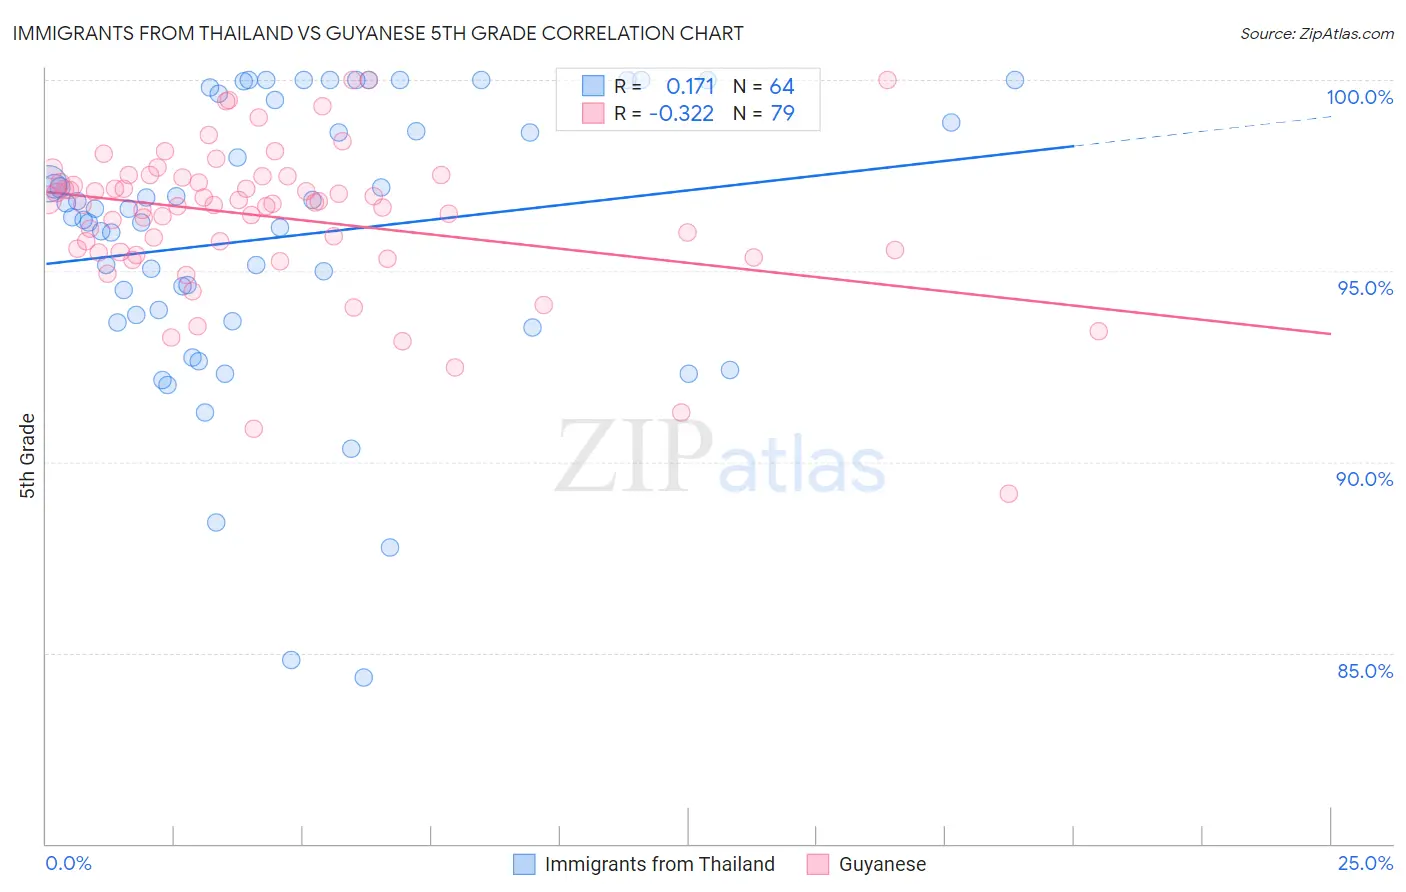
Immigrants from Thailand vs Guyanese 5th Grade Correlation Chart
The statistical analysis conducted on geographies consisting of 317,004,290 people shows a poor positive correlation between the proportion of Immigrants from Thailand and percentage of population with at least 5th grade education in the United States with a correlation coefficient (R) of 0.171 and weighted average of 96.6%. Similarly, the statistical analysis conducted on geographies consisting of 176,921,765 people shows a mild negative correlation between the proportion of Guyanese and percentage of population with at least 5th grade education in the United States with a correlation coefficient (R) of -0.322 and weighted average of 96.1%, a difference of 0.51%.
5th Grade Correlation Summary
| Measurement | Immigrants from Thailand | Guyanese |
| Minimum | 84.4% | 89.2% |
| Maximum | 100.0% | 100.0% |
| Range | 15.6% | 10.8% |
| Mean | 95.9% | 96.4% |
| Median | 96.5% | 96.8% |
| Interquartile 25% (IQ1) | 93.8% | 95.5% |
| Interquartile 75% (IQ3) | 99.2% | 97.5% |
| Interquartile Range (IQR) | 5.4% | 2.0% |
| Standard Deviation (Sample) | 3.7% | 2.0% |
| Standard Deviation (Population) | 3.7% | 2.0% |
Demographics Similar to Immigrants from Thailand and Guyanese by 5th Grade
In terms of 5th grade, the demographic groups most similar to Immigrants from Thailand are Immigrants from St. Vincent and the Grenadines (96.6%, a difference of 0.0%), Immigrants from Trinidad and Tobago (96.6%, a difference of 0.020%), Immigrants from Afghanistan (96.6%, a difference of 0.030%), Immigrants from Barbados (96.6%, a difference of 0.030%), and Immigrants from West Indies (96.5%, a difference of 0.10%). Similarly, the demographic groups most similar to Guyanese are Immigrants from Cuba (96.1%, a difference of 0.010%), Puerto Rican (96.1%, a difference of 0.010%), Sri Lankan (96.1%, a difference of 0.030%), Immigrants from Burma/Myanmar (96.1%, a difference of 0.040%), and Immigrants (96.2%, a difference of 0.080%).
| Demographics | Rating | Rank | 5th Grade |
| Immigrants | Trinidad and Tobago | 0.1 /100 | #284 | Tragic 96.6% |
| Immigrants | St. Vincent and the Grenadines | 0.1 /100 | #285 | Tragic 96.6% |
| Immigrants | Thailand | 0.1 /100 | #286 | Tragic 96.6% |
| Immigrants | Afghanistan | 0.1 /100 | #287 | Tragic 96.6% |
| Immigrants | Barbados | 0.0 /100 | #288 | Tragic 96.6% |
| Immigrants | West Indies | 0.0 /100 | #289 | Tragic 96.5% |
| British West Indians | 0.0 /100 | #290 | Tragic 96.5% |
| Malaysians | 0.0 /100 | #291 | Tragic 96.5% |
| Somalis | 0.0 /100 | #292 | Tragic 96.5% |
| Immigrants | Grenada | 0.0 /100 | #293 | Tragic 96.5% |
| Immigrants | Eritrea | 0.0 /100 | #294 | Tragic 96.4% |
| Immigrants | Somalia | 0.0 /100 | #295 | Tragic 96.4% |
| Immigrants | South Eastern Asia | 0.0 /100 | #296 | Tragic 96.3% |
| Haitians | 0.0 /100 | #297 | Tragic 96.3% |
| Immigrants | Dominica | 0.0 /100 | #298 | Tragic 96.2% |
| Immigrants | Immigrants | 0.0 /100 | #299 | Tragic 96.2% |
| Sri Lankans | 0.0 /100 | #300 | Tragic 96.1% |
| Immigrants | Cuba | 0.0 /100 | #301 | Tragic 96.1% |
| Guyanese | 0.0 /100 | #302 | Tragic 96.1% |
| Puerto Ricans | 0.0 /100 | #303 | Tragic 96.1% |
| Immigrants | Burma/Myanmar | 0.0 /100 | #304 | Tragic 96.1% |