Immigrants from Taiwan vs Uruguayan 7th Grade
COMPARE
Immigrants from Taiwan
Uruguayan
7th Grade
7th Grade Comparison
Immigrants from Taiwan
Uruguayans
96.1%
7TH GRADE
61.5/ 100
METRIC RATING
165th/ 347
METRIC RANK
95.4%
7TH GRADE
1.6/ 100
METRIC RATING
244th/ 347
METRIC RANK
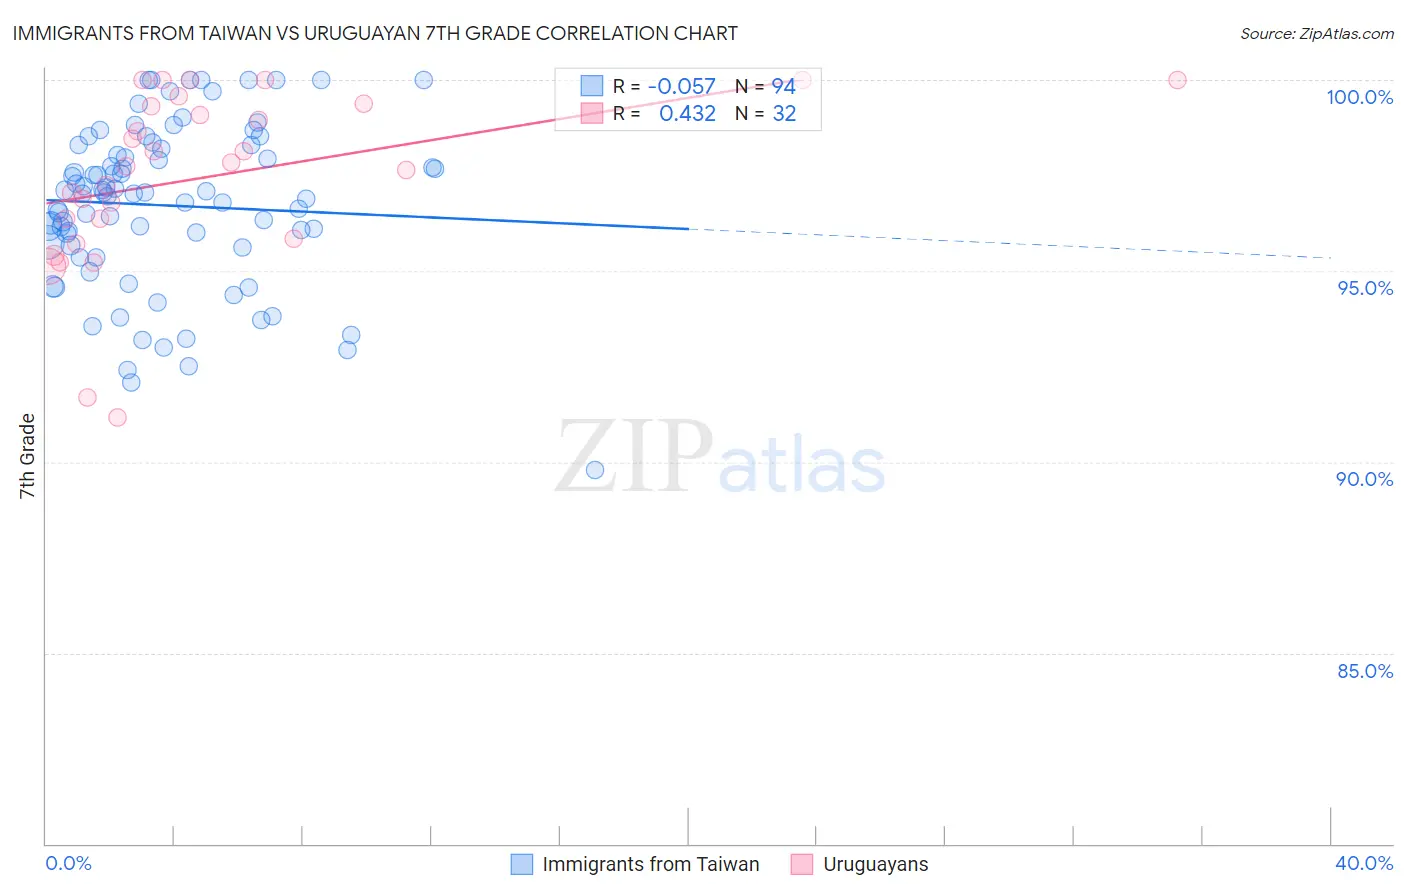
Immigrants from Taiwan vs Uruguayan 7th Grade Correlation Chart
The statistical analysis conducted on geographies consisting of 298,069,199 people shows a slight negative correlation between the proportion of Immigrants from Taiwan and percentage of population with at least 7th grade education in the United States with a correlation coefficient (R) of -0.057 and weighted average of 96.1%. Similarly, the statistical analysis conducted on geographies consisting of 144,782,794 people shows a moderate positive correlation between the proportion of Uruguayans and percentage of population with at least 7th grade education in the United States with a correlation coefficient (R) of 0.432 and weighted average of 95.4%, a difference of 0.71%.
7th Grade Correlation Summary
| Measurement | Immigrants from Taiwan | Uruguayan |
| Minimum | 89.8% | 91.2% |
| Maximum | 100.0% | 100.0% |
| Range | 10.2% | 8.8% |
| Mean | 96.7% | 97.5% |
| Median | 97.0% | 97.8% |
| Interquartile 25% (IQ1) | 95.7% | 96.1% |
| Interquartile 75% (IQ3) | 98.2% | 99.3% |
| Interquartile Range (IQR) | 2.5% | 3.3% |
| Standard Deviation (Sample) | 2.1% | 2.3% |
| Standard Deviation (Population) | 2.1% | 2.2% |
Similar Demographics by 7th Grade
Demographics Similar to Immigrants from Taiwan by 7th Grade
In terms of 7th grade, the demographic groups most similar to Immigrants from Taiwan are Immigrants from Italy (96.1%, a difference of 0.0%), Immigrants from Kazakhstan (96.1%, a difference of 0.0%), Spaniard (96.1%, a difference of 0.010%), Immigrants from Sri Lanka (96.1%, a difference of 0.010%), and Pima (96.1%, a difference of 0.020%).
| Demographics | Rating | Rank | 7th Grade |
| Arabs | 68.6 /100 | #158 | Good 96.2% |
| Alsatians | 67.2 /100 | #159 | Good 96.1% |
| Immigrants | Kenya | 66.8 /100 | #160 | Good 96.1% |
| Bermudans | 66.3 /100 | #161 | Good 96.1% |
| Pima | 64.3 /100 | #162 | Good 96.1% |
| Spaniards | 62.6 /100 | #163 | Good 96.1% |
| Immigrants | Italy | 62.1 /100 | #164 | Good 96.1% |
| Immigrants | Taiwan | 61.5 /100 | #165 | Good 96.1% |
| Immigrants | Kazakhstan | 61.0 /100 | #166 | Good 96.1% |
| Immigrants | Sri Lanka | 59.9 /100 | #167 | Average 96.1% |
| Immigrants | Poland | 59.0 /100 | #168 | Average 96.1% |
| Ute | 55.8 /100 | #169 | Average 96.1% |
| Immigrants | Ukraine | 55.0 /100 | #170 | Average 96.1% |
| Egyptians | 54.2 /100 | #171 | Average 96.1% |
| Venezuelans | 51.4 /100 | #172 | Average 96.0% |
Demographics Similar to Uruguayans by 7th Grade
In terms of 7th grade, the demographic groups most similar to Uruguayans are U.S. Virgin Islander (95.4%, a difference of 0.0%), Immigrants from Middle Africa (95.4%, a difference of 0.010%), Ethiopian (95.4%, a difference of 0.010%), Immigrants from Sierra Leone (95.5%, a difference of 0.030%), and South American Indian (95.5%, a difference of 0.030%).
| Demographics | Rating | Rank | 7th Grade |
| Immigrants | Asia | 2.3 /100 | #237 | Tragic 95.5% |
| Indians (Asian) | 2.3 /100 | #238 | Tragic 95.5% |
| Jamaicans | 2.2 /100 | #239 | Tragic 95.5% |
| Immigrants | Sierra Leone | 2.0 /100 | #240 | Tragic 95.5% |
| South American Indians | 2.0 /100 | #241 | Tragic 95.5% |
| Immigrants | Senegal | 1.9 /100 | #242 | Tragic 95.5% |
| U.S. Virgin Islanders | 1.6 /100 | #243 | Tragic 95.4% |
| Uruguayans | 1.6 /100 | #244 | Tragic 95.4% |
| Immigrants | Middle Africa | 1.5 /100 | #245 | Tragic 95.4% |
| Ethiopians | 1.5 /100 | #246 | Tragic 95.4% |
| Tongans | 1.3 /100 | #247 | Tragic 95.4% |
| Paiute | 1.2 /100 | #248 | Tragic 95.4% |
| Bolivians | 1.1 /100 | #249 | Tragic 95.4% |
| Immigrants | Cameroon | 0.9 /100 | #250 | Tragic 95.4% |
| Immigrants | Jamaica | 0.9 /100 | #251 | Tragic 95.4% |