Immigrants from Taiwan vs Czech 7th Grade
COMPARE
Immigrants from Taiwan
Czech
7th Grade
7th Grade Comparison
Immigrants from Taiwan
Czechs
96.1%
7TH GRADE
61.5/ 100
METRIC RATING
165th/ 347
METRIC RANK
97.4%
7TH GRADE
100.0/ 100
METRIC RATING
30th/ 347
METRIC RANK
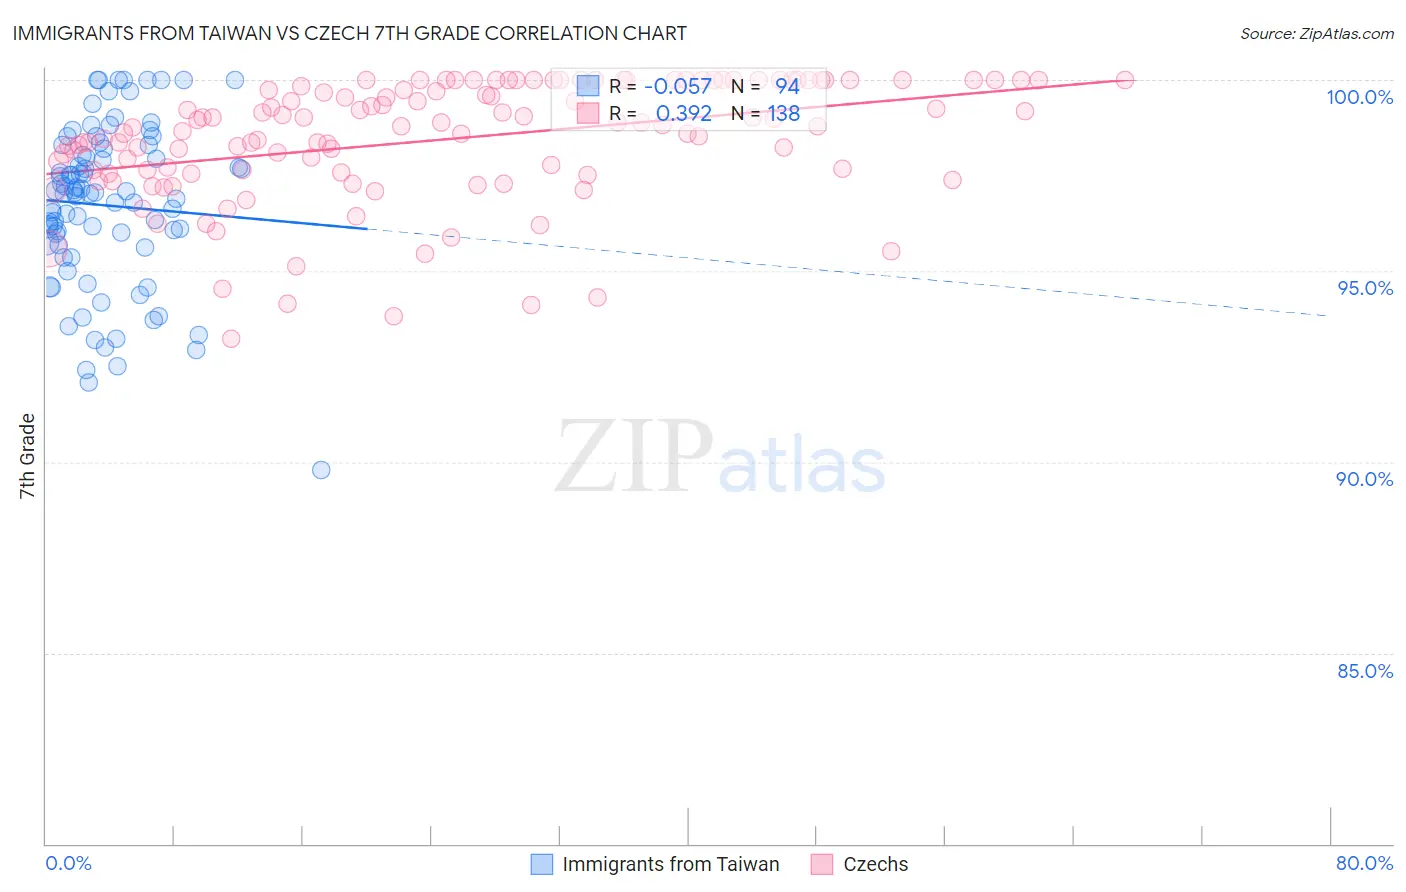
Immigrants from Taiwan vs Czech 7th Grade Correlation Chart
The statistical analysis conducted on geographies consisting of 298,069,199 people shows a slight negative correlation between the proportion of Immigrants from Taiwan and percentage of population with at least 7th grade education in the United States with a correlation coefficient (R) of -0.057 and weighted average of 96.1%. Similarly, the statistical analysis conducted on geographies consisting of 484,805,615 people shows a mild positive correlation between the proportion of Czechs and percentage of population with at least 7th grade education in the United States with a correlation coefficient (R) of 0.392 and weighted average of 97.4%, a difference of 1.3%.
7th Grade Correlation Summary
| Measurement | Immigrants from Taiwan | Czech |
| Minimum | 89.8% | 93.2% |
| Maximum | 100.0% | 100.0% |
| Range | 10.2% | 6.8% |
| Mean | 96.7% | 98.4% |
| Median | 97.0% | 98.8% |
| Interquartile 25% (IQ1) | 95.7% | 97.6% |
| Interquartile 75% (IQ3) | 98.2% | 100.0% |
| Interquartile Range (IQR) | 2.5% | 2.4% |
| Standard Deviation (Sample) | 2.1% | 1.6% |
| Standard Deviation (Population) | 2.1% | 1.6% |
Similar Demographics by 7th Grade
Demographics Similar to Immigrants from Taiwan by 7th Grade
In terms of 7th grade, the demographic groups most similar to Immigrants from Taiwan are Immigrants from Italy (96.1%, a difference of 0.0%), Immigrants from Kazakhstan (96.1%, a difference of 0.0%), Spaniard (96.1%, a difference of 0.010%), Immigrants from Sri Lanka (96.1%, a difference of 0.010%), and Pima (96.1%, a difference of 0.020%).
| Demographics | Rating | Rank | 7th Grade |
| Arabs | 68.6 /100 | #158 | Good 96.2% |
| Alsatians | 67.2 /100 | #159 | Good 96.1% |
| Immigrants | Kenya | 66.8 /100 | #160 | Good 96.1% |
| Bermudans | 66.3 /100 | #161 | Good 96.1% |
| Pima | 64.3 /100 | #162 | Good 96.1% |
| Spaniards | 62.6 /100 | #163 | Good 96.1% |
| Immigrants | Italy | 62.1 /100 | #164 | Good 96.1% |
| Immigrants | Taiwan | 61.5 /100 | #165 | Good 96.1% |
| Immigrants | Kazakhstan | 61.0 /100 | #166 | Good 96.1% |
| Immigrants | Sri Lanka | 59.9 /100 | #167 | Average 96.1% |
| Immigrants | Poland | 59.0 /100 | #168 | Average 96.1% |
| Ute | 55.8 /100 | #169 | Average 96.1% |
| Immigrants | Ukraine | 55.0 /100 | #170 | Average 96.1% |
| Egyptians | 54.2 /100 | #171 | Average 96.1% |
| Venezuelans | 51.4 /100 | #172 | Average 96.0% |
Demographics Similar to Czechs by 7th Grade
In terms of 7th grade, the demographic groups most similar to Czechs are Sioux (97.4%, a difference of 0.010%), Scandinavian (97.4%, a difference of 0.010%), European (97.3%, a difference of 0.020%), Italian (97.3%, a difference of 0.020%), and Scotch-Irish (97.4%, a difference of 0.030%).
| Demographics | Rating | Rank | 7th Grade |
| Croatians | 100.0 /100 | #23 | Exceptional 97.4% |
| Welsh | 100.0 /100 | #24 | Exceptional 97.4% |
| French | 100.0 /100 | #25 | Exceptional 97.4% |
| Scotch-Irish | 100.0 /100 | #26 | Exceptional 97.4% |
| Danes | 100.0 /100 | #27 | Exceptional 97.4% |
| Sioux | 100.0 /100 | #28 | Exceptional 97.4% |
| Scandinavians | 100.0 /100 | #29 | Exceptional 97.4% |
| Czechs | 100.0 /100 | #30 | Exceptional 97.4% |
| Europeans | 100.0 /100 | #31 | Exceptional 97.3% |
| Italians | 100.0 /100 | #32 | Exceptional 97.3% |
| Chippewa | 100.0 /100 | #33 | Exceptional 97.3% |
| Alaska Natives | 100.0 /100 | #34 | Exceptional 97.3% |
| Swiss | 100.0 /100 | #35 | Exceptional 97.3% |
| Hungarians | 100.0 /100 | #36 | Exceptional 97.2% |
| British | 100.0 /100 | #37 | Exceptional 97.2% |