Immigrants from Taiwan vs Kiowa 9th Grade
COMPARE
Immigrants from Taiwan
Kiowa
9th Grade
9th Grade Comparison
Immigrants from Taiwan
Kiowa
95.2%
9TH GRADE
85.3/ 100
METRIC RATING
140th/ 347
METRIC RANK
95.4%
9TH GRADE
95.3/ 100
METRIC RATING
123rd/ 347
METRIC RANK
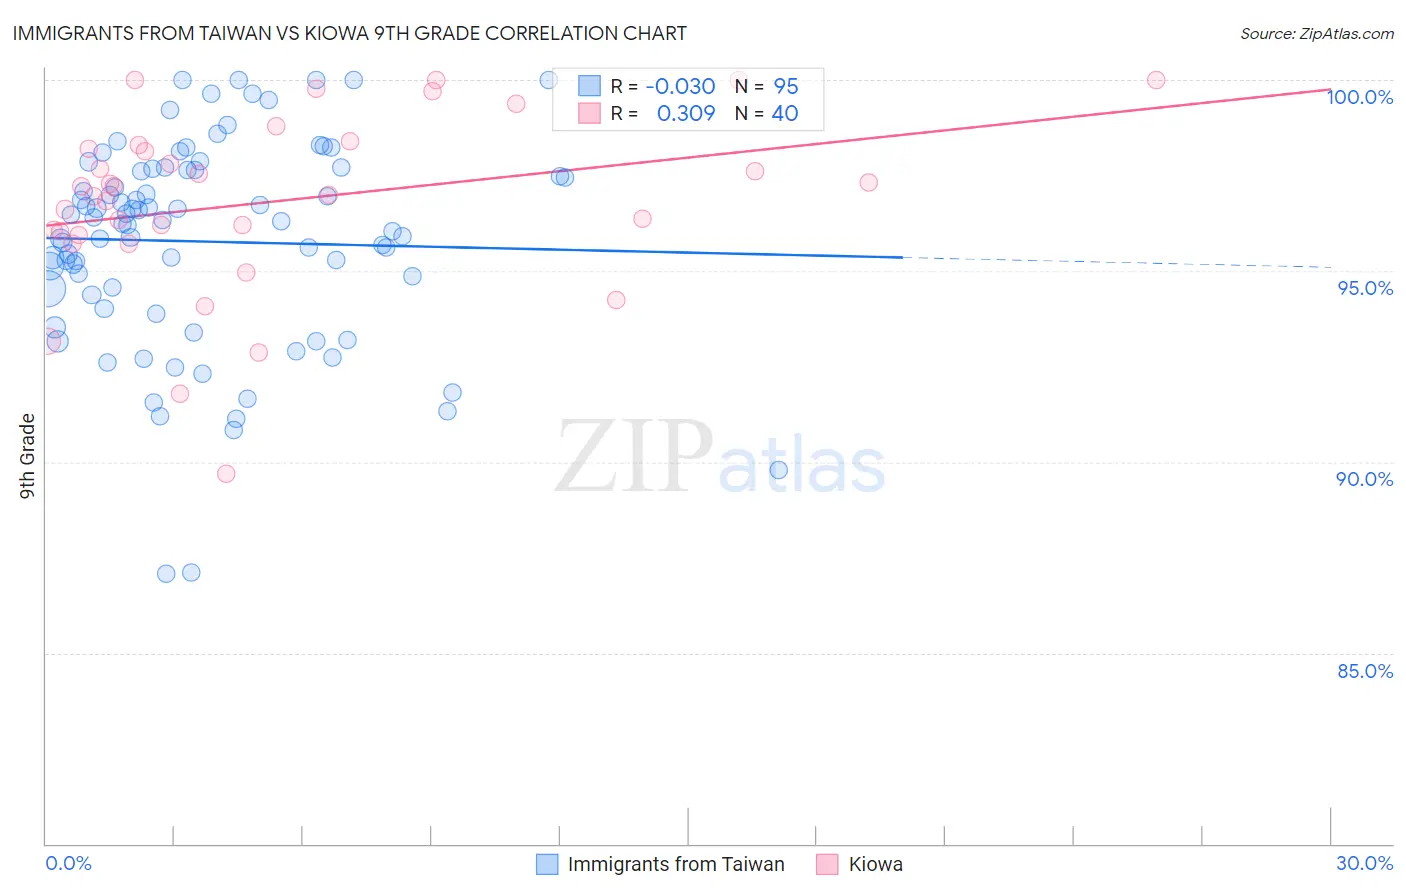
Immigrants from Taiwan vs Kiowa 9th Grade Correlation Chart
The statistical analysis conducted on geographies consisting of 298,292,402 people shows no correlation between the proportion of Immigrants from Taiwan and percentage of population with at least 9th grade education in the United States with a correlation coefficient (R) of -0.030 and weighted average of 95.2%. Similarly, the statistical analysis conducted on geographies consisting of 56,101,600 people shows a mild positive correlation between the proportion of Kiowa and percentage of population with at least 9th grade education in the United States with a correlation coefficient (R) of 0.309 and weighted average of 95.4%, a difference of 0.23%.
9th Grade Correlation Summary
| Measurement | Immigrants from Taiwan | Kiowa |
| Minimum | 87.1% | 89.7% |
| Maximum | 100.0% | 100.0% |
| Range | 12.9% | 10.3% |
| Mean | 95.8% | 96.8% |
| Median | 96.3% | 97.1% |
| Interquartile 25% (IQ1) | 94.4% | 96.0% |
| Interquartile 75% (IQ3) | 97.6% | 98.2% |
| Interquartile Range (IQR) | 3.3% | 2.2% |
| Standard Deviation (Sample) | 2.7% | 2.3% |
| Standard Deviation (Population) | 2.7% | 2.3% |
Demographics Similar to Immigrants from Taiwan and Kiowa by 9th Grade
In terms of 9th grade, the demographic groups most similar to Immigrants from Taiwan are Immigrants from Bosnia and Herzegovina (95.2%, a difference of 0.0%), Immigrants from Eastern Europe (95.2%, a difference of 0.010%), Immigrants from Russia (95.2%, a difference of 0.020%), Hmong (95.2%, a difference of 0.040%), and Immigrants from Iran (95.2%, a difference of 0.050%). Similarly, the demographic groups most similar to Kiowa are Shoshone (95.4%, a difference of 0.0%), Cree (95.4%, a difference of 0.010%), Immigrants from Kuwait (95.4%, a difference of 0.010%), Immigrants from South Central Asia (95.4%, a difference of 0.010%), and Immigrants from Serbia (95.4%, a difference of 0.030%).
| Demographics | Rating | Rank | 9th Grade |
| Cree | 95.5 /100 | #121 | Exceptional 95.4% |
| Immigrants | Kuwait | 95.5 /100 | #122 | Exceptional 95.4% |
| Kiowa | 95.3 /100 | #123 | Exceptional 95.4% |
| Shoshone | 95.3 /100 | #124 | Exceptional 95.4% |
| Immigrants | South Central Asia | 95.1 /100 | #125 | Exceptional 95.4% |
| Immigrants | Serbia | 94.4 /100 | #126 | Exceptional 95.4% |
| Palestinians | 94.3 /100 | #127 | Exceptional 95.4% |
| Immigrants | Hungary | 94.2 /100 | #128 | Exceptional 95.4% |
| Basques | 94.1 /100 | #129 | Exceptional 95.4% |
| Jordanians | 93.5 /100 | #130 | Exceptional 95.3% |
| Immigrants | North Macedonia | 92.3 /100 | #131 | Exceptional 95.3% |
| Immigrants | Nonimmigrants | 92.0 /100 | #132 | Exceptional 95.3% |
| Israelis | 90.4 /100 | #133 | Exceptional 95.3% |
| Immigrants | Israel | 89.6 /100 | #134 | Excellent 95.3% |
| Immigrants | Belarus | 88.9 /100 | #135 | Excellent 95.2% |
| Immigrants | Iran | 88.3 /100 | #136 | Excellent 95.2% |
| Hmong | 87.7 /100 | #137 | Excellent 95.2% |
| Immigrants | Russia | 86.6 /100 | #138 | Excellent 95.2% |
| Immigrants | Eastern Europe | 85.8 /100 | #139 | Excellent 95.2% |
| Immigrants | Taiwan | 85.3 /100 | #140 | Excellent 95.2% |
| Immigrants | Bosnia and Herzegovina | 85.2 /100 | #141 | Excellent 95.2% |