Immigrants from Taiwan vs Immigrants from Brazil 9th Grade
COMPARE
Immigrants from Taiwan
Immigrants from Brazil
9th Grade
9th Grade Comparison
Immigrants from Taiwan
Immigrants from Brazil
95.2%
9TH GRADE
85.3/ 100
METRIC RATING
140th/ 347
METRIC RANK
95.0%
9TH GRADE
61.1/ 100
METRIC RATING
167th/ 347
METRIC RANK
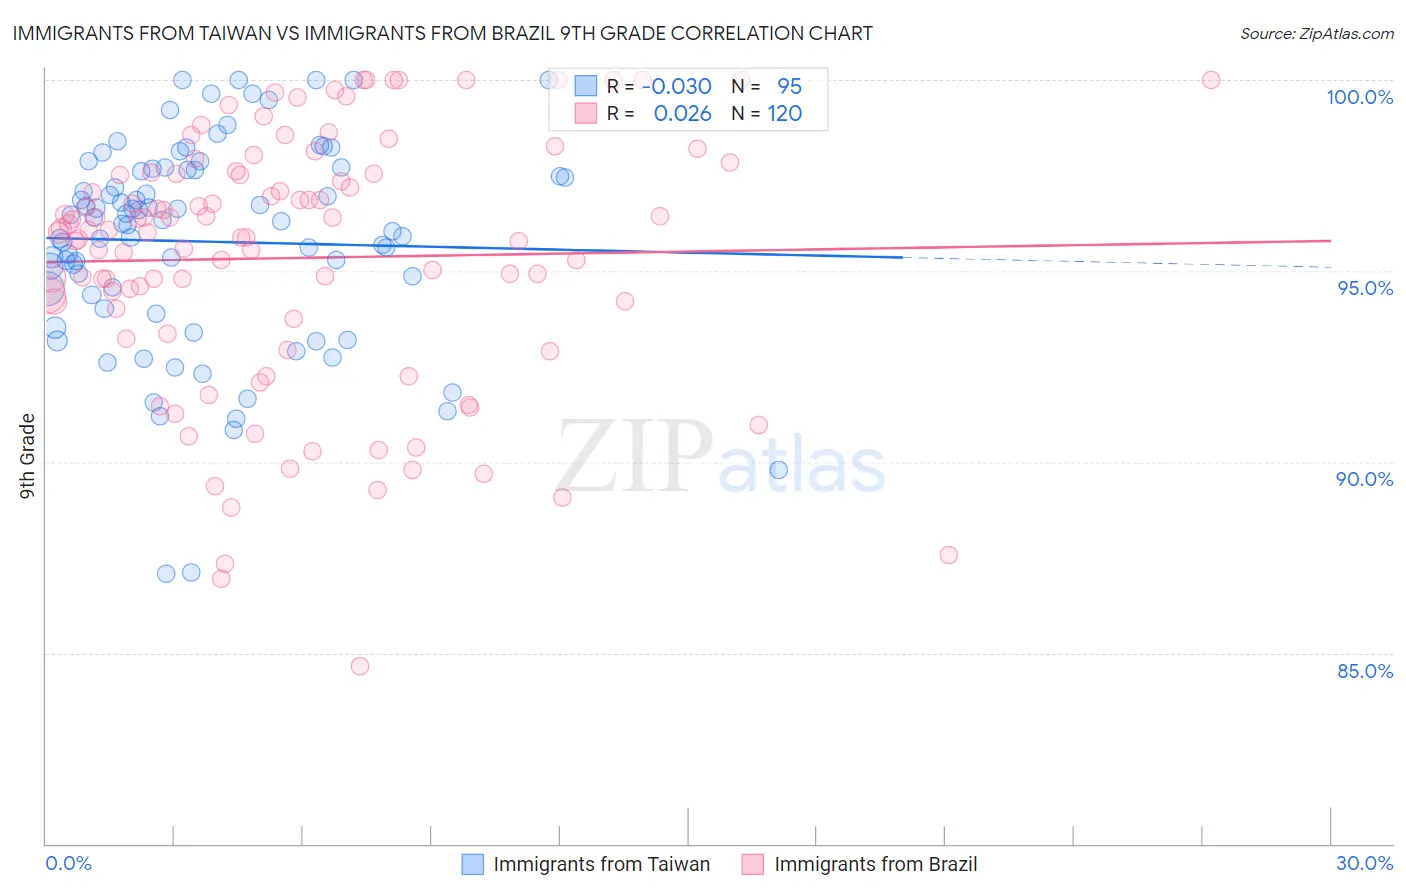
Immigrants from Taiwan vs Immigrants from Brazil 9th Grade Correlation Chart
The statistical analysis conducted on geographies consisting of 298,292,402 people shows no correlation between the proportion of Immigrants from Taiwan and percentage of population with at least 9th grade education in the United States with a correlation coefficient (R) of -0.030 and weighted average of 95.2%. Similarly, the statistical analysis conducted on geographies consisting of 342,965,001 people shows no correlation between the proportion of Immigrants from Brazil and percentage of population with at least 9th grade education in the United States with a correlation coefficient (R) of 0.026 and weighted average of 95.0%, a difference of 0.24%.
9th Grade Correlation Summary
| Measurement | Immigrants from Taiwan | Immigrants from Brazil |
| Minimum | 87.1% | 84.7% |
| Maximum | 100.0% | 100.0% |
| Range | 12.9% | 15.3% |
| Mean | 95.8% | 95.3% |
| Median | 96.3% | 96.0% |
| Interquartile 25% (IQ1) | 94.4% | 93.9% |
| Interquartile 75% (IQ3) | 97.6% | 97.5% |
| Interquartile Range (IQR) | 3.3% | 3.7% |
| Standard Deviation (Sample) | 2.7% | 3.3% |
| Standard Deviation (Population) | 2.7% | 3.3% |
Similar Demographics by 9th Grade
Demographics Similar to Immigrants from Taiwan by 9th Grade
In terms of 9th grade, the demographic groups most similar to Immigrants from Taiwan are Immigrants from Bosnia and Herzegovina (95.2%, a difference of 0.0%), Immigrants from Eastern Europe (95.2%, a difference of 0.010%), Immigrants from Greece (95.2%, a difference of 0.010%), Spanish (95.2%, a difference of 0.010%), and Immigrants from Russia (95.2%, a difference of 0.020%).
| Demographics | Rating | Rank | 9th Grade |
| Israelis | 90.4 /100 | #133 | Exceptional 95.3% |
| Immigrants | Israel | 89.6 /100 | #134 | Excellent 95.3% |
| Immigrants | Belarus | 88.9 /100 | #135 | Excellent 95.2% |
| Immigrants | Iran | 88.3 /100 | #136 | Excellent 95.2% |
| Hmong | 87.7 /100 | #137 | Excellent 95.2% |
| Immigrants | Russia | 86.6 /100 | #138 | Excellent 95.2% |
| Immigrants | Eastern Europe | 85.8 /100 | #139 | Excellent 95.2% |
| Immigrants | Taiwan | 85.3 /100 | #140 | Excellent 95.2% |
| Immigrants | Bosnia and Herzegovina | 85.2 /100 | #141 | Excellent 95.2% |
| Immigrants | Greece | 84.6 /100 | #142 | Excellent 95.2% |
| Spanish | 84.4 /100 | #143 | Excellent 95.2% |
| Yup'ik | 83.3 /100 | #144 | Excellent 95.2% |
| Pueblo | 82.2 /100 | #145 | Excellent 95.1% |
| Immigrants | Sri Lanka | 82.1 /100 | #146 | Excellent 95.1% |
| Choctaw | 81.9 /100 | #147 | Excellent 95.1% |
Demographics Similar to Immigrants from Brazil by 9th Grade
In terms of 9th grade, the demographic groups most similar to Immigrants from Brazil are Chilean (95.0%, a difference of 0.0%), Blackfeet (95.0%, a difference of 0.010%), Ute (95.0%, a difference of 0.010%), Spaniard (94.9%, a difference of 0.010%), and Pakistani (95.0%, a difference of 0.020%).
| Demographics | Rating | Rank | 9th Grade |
| Immigrants | Italy | 66.6 /100 | #160 | Good 95.0% |
| French American Indians | 66.5 /100 | #161 | Good 95.0% |
| Bermudans | 65.8 /100 | #162 | Good 95.0% |
| Pakistanis | 64.1 /100 | #163 | Good 95.0% |
| Venezuelans | 63.6 /100 | #164 | Good 95.0% |
| Blackfeet | 62.6 /100 | #165 | Good 95.0% |
| Ute | 62.6 /100 | #166 | Good 95.0% |
| Immigrants | Brazil | 61.1 /100 | #167 | Good 95.0% |
| Chileans | 60.7 /100 | #168 | Good 95.0% |
| Spaniards | 59.6 /100 | #169 | Average 94.9% |
| Alsatians | 58.6 /100 | #170 | Average 94.9% |
| Colville | 58.5 /100 | #171 | Average 94.9% |
| Iraqis | 54.0 /100 | #172 | Average 94.9% |
| Cheyenne | 51.5 /100 | #173 | Average 94.9% |
| Immigrants | Egypt | 50.0 /100 | #174 | Average 94.9% |