Immigrants from Taiwan vs Dominican Professional Degree
COMPARE
Immigrants from Taiwan
Dominican
Professional Degree
Professional Degree Comparison
Immigrants from Taiwan
Dominicans
7.1%
PROFESSIONAL DEGREE
100.0/ 100
METRIC RATING
9th/ 347
METRIC RANK
3.5%
PROFESSIONAL DEGREE
0.5/ 100
METRIC RATING
280th/ 347
METRIC RANK
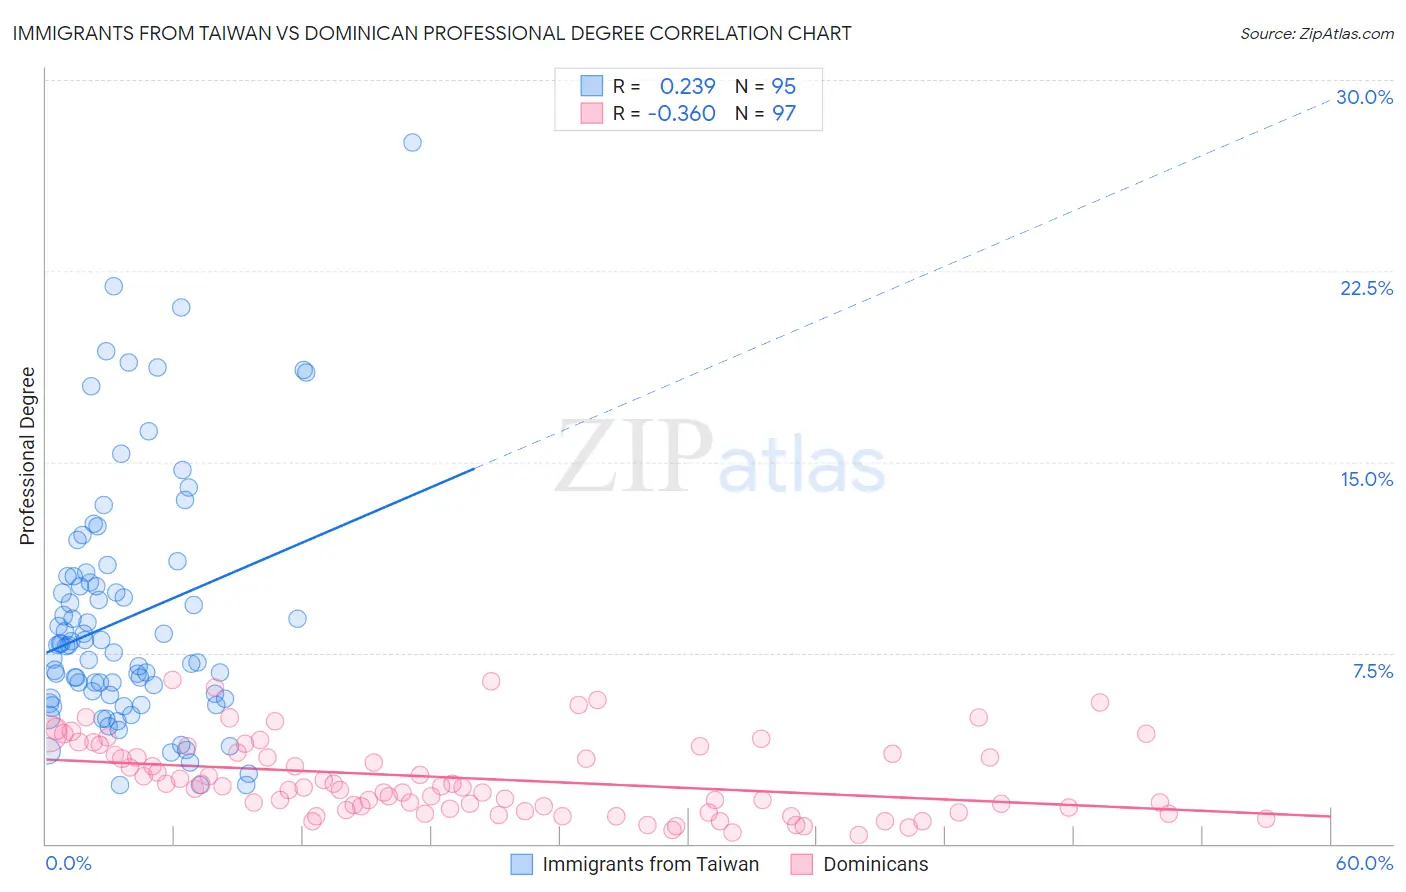
Immigrants from Taiwan vs Dominican Professional Degree Correlation Chart
The statistical analysis conducted on geographies consisting of 298,058,509 people shows a weak positive correlation between the proportion of Immigrants from Taiwan and percentage of population with at least professional degree education in the United States with a correlation coefficient (R) of 0.239 and weighted average of 7.1%. Similarly, the statistical analysis conducted on geographies consisting of 354,076,987 people shows a mild negative correlation between the proportion of Dominicans and percentage of population with at least professional degree education in the United States with a correlation coefficient (R) of -0.360 and weighted average of 3.5%, a difference of 99.4%.
Professional Degree Correlation Summary
| Measurement | Immigrants from Taiwan | Dominican |
| Minimum | 2.3% | 0.36% |
| Maximum | 27.6% | 6.5% |
| Range | 25.2% | 6.1% |
| Mean | 8.9% | 2.6% |
| Median | 7.8% | 2.2% |
| Interquartile 25% (IQ1) | 5.7% | 1.3% |
| Interquartile 75% (IQ3) | 10.5% | 3.7% |
| Interquartile Range (IQR) | 4.8% | 2.4% |
| Standard Deviation (Sample) | 4.8% | 1.5% |
| Standard Deviation (Population) | 4.8% | 1.5% |
Similar Demographics by Professional Degree
Demographics Similar to Immigrants from Taiwan by Professional Degree
In terms of professional degree, the demographic groups most similar to Immigrants from Taiwan are Immigrants from Switzerland (7.1%, a difference of 0.19%), Eastern European (7.1%, a difference of 0.33%), Immigrants from Belgium (7.0%, a difference of 1.7%), Cypriot (6.9%, a difference of 1.9%), and Israeli (6.9%, a difference of 2.0%).
| Demographics | Rating | Rank | Professional Degree |
| Immigrants | Singapore | 100.0 /100 | #2 | Exceptional 7.7% |
| Iranians | 100.0 /100 | #3 | Exceptional 7.6% |
| Filipinos | 100.0 /100 | #4 | Exceptional 7.6% |
| Immigrants | Iran | 100.0 /100 | #5 | Exceptional 7.3% |
| Okinawans | 100.0 /100 | #6 | Exceptional 7.3% |
| Eastern Europeans | 100.0 /100 | #7 | Exceptional 7.1% |
| Immigrants | Switzerland | 100.0 /100 | #8 | Exceptional 7.1% |
| Immigrants | Taiwan | 100.0 /100 | #9 | Exceptional 7.1% |
| Immigrants | Belgium | 100.0 /100 | #10 | Exceptional 7.0% |
| Cypriots | 100.0 /100 | #11 | Exceptional 6.9% |
| Israelis | 100.0 /100 | #12 | Exceptional 6.9% |
| Immigrants | Australia | 100.0 /100 | #13 | Exceptional 6.9% |
| Immigrants | France | 100.0 /100 | #14 | Exceptional 6.8% |
| Immigrants | China | 100.0 /100 | #15 | Exceptional 6.7% |
| Immigrants | Sweden | 100.0 /100 | #16 | Exceptional 6.7% |
Demographics Similar to Dominicans by Professional Degree
In terms of professional degree, the demographic groups most similar to Dominicans are Apache (3.5%, a difference of 0.030%), Immigrants from Portugal (3.5%, a difference of 0.040%), Immigrants from Caribbean (3.5%, a difference of 0.050%), Japanese (3.5%, a difference of 0.080%), and Cheyenne (3.6%, a difference of 0.13%).
| Demographics | Rating | Rank | Professional Degree |
| Americans | 0.5 /100 | #273 | Tragic 3.6% |
| Potawatomi | 0.5 /100 | #274 | Tragic 3.6% |
| Immigrants | Dominica | 0.5 /100 | #275 | Tragic 3.6% |
| Liberians | 0.5 /100 | #276 | Tragic 3.6% |
| Cheyenne | 0.5 /100 | #277 | Tragic 3.6% |
| Japanese | 0.5 /100 | #278 | Tragic 3.5% |
| Immigrants | Portugal | 0.5 /100 | #279 | Tragic 3.5% |
| Dominicans | 0.5 /100 | #280 | Tragic 3.5% |
| Apache | 0.5 /100 | #281 | Tragic 3.5% |
| Immigrants | Caribbean | 0.5 /100 | #282 | Tragic 3.5% |
| Comanche | 0.4 /100 | #283 | Tragic 3.5% |
| Salvadorans | 0.4 /100 | #284 | Tragic 3.5% |
| Hondurans | 0.3 /100 | #285 | Tragic 3.5% |
| Haitians | 0.3 /100 | #286 | Tragic 3.5% |
| Immigrants | El Salvador | 0.3 /100 | #287 | Tragic 3.5% |