Barbadian vs Dominican Professional Degree
COMPARE
Barbadian
Dominican
Professional Degree
Professional Degree Comparison
Barbadians
Dominicans
4.1%
PROFESSIONAL DEGREE
15.8/ 100
METRIC RATING
204th/ 347
METRIC RANK
3.5%
PROFESSIONAL DEGREE
0.5/ 100
METRIC RATING
280th/ 347
METRIC RANK
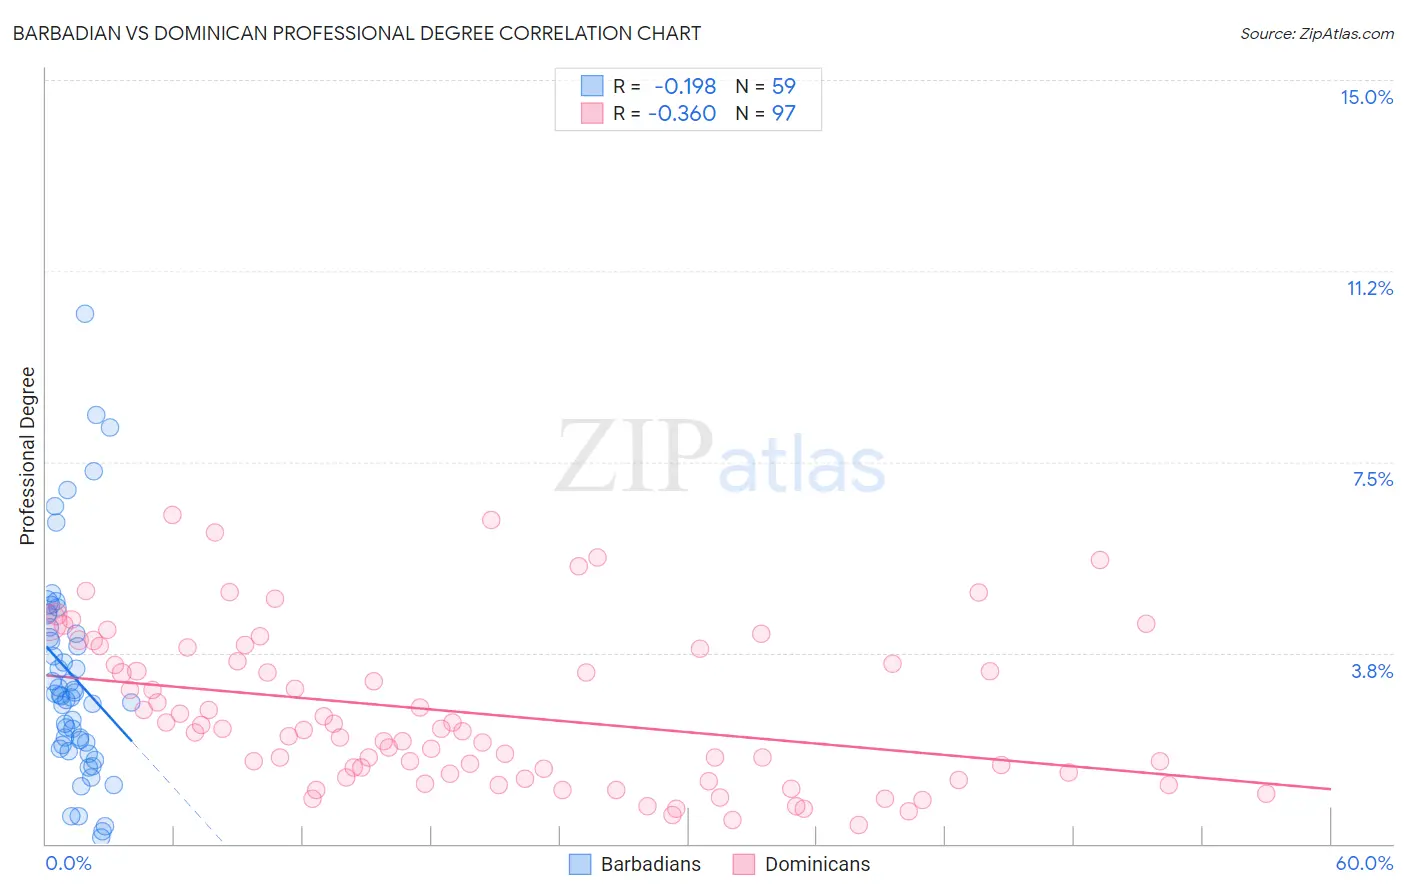
Barbadian vs Dominican Professional Degree Correlation Chart
The statistical analysis conducted on geographies consisting of 141,223,828 people shows a poor negative correlation between the proportion of Barbadians and percentage of population with at least professional degree education in the United States with a correlation coefficient (R) of -0.198 and weighted average of 4.1%. Similarly, the statistical analysis conducted on geographies consisting of 354,076,987 people shows a mild negative correlation between the proportion of Dominicans and percentage of population with at least professional degree education in the United States with a correlation coefficient (R) of -0.360 and weighted average of 3.5%, a difference of 16.7%.
Professional Degree Correlation Summary
| Measurement | Barbadian | Dominican |
| Minimum | 0.13% | 0.36% |
| Maximum | 10.4% | 6.5% |
| Range | 10.3% | 6.1% |
| Mean | 3.3% | 2.6% |
| Median | 2.9% | 2.2% |
| Interquartile 25% (IQ1) | 1.9% | 1.3% |
| Interquartile 75% (IQ3) | 4.2% | 3.7% |
| Interquartile Range (IQR) | 2.3% | 2.4% |
| Standard Deviation (Sample) | 2.1% | 1.5% |
| Standard Deviation (Population) | 2.1% | 1.5% |
Similar Demographics by Professional Degree
Demographics Similar to Barbadians by Professional Degree
In terms of professional degree, the demographic groups most similar to Barbadians are Panamanian (4.1%, a difference of 0.030%), Somali (4.1%, a difference of 0.32%), Immigrants from Iraq (4.2%, a difference of 0.36%), Yugoslavian (4.1%, a difference of 0.75%), and Finnish (4.2%, a difference of 0.79%).
| Demographics | Rating | Rank | Professional Degree |
| Czechoslovakians | 22.4 /100 | #197 | Fair 4.2% |
| Immigrants | Middle Africa | 22.1 /100 | #198 | Fair 4.2% |
| Norwegians | 20.5 /100 | #199 | Fair 4.2% |
| Immigrants | North Macedonia | 20.2 /100 | #200 | Fair 4.2% |
| Finns | 18.7 /100 | #201 | Poor 4.2% |
| Immigrants | Iraq | 17.1 /100 | #202 | Poor 4.2% |
| Panamanians | 15.9 /100 | #203 | Poor 4.1% |
| Barbadians | 15.8 /100 | #204 | Poor 4.1% |
| Somalis | 14.8 /100 | #205 | Poor 4.1% |
| Yugoslavians | 13.4 /100 | #206 | Poor 4.1% |
| Sub-Saharan Africans | 12.8 /100 | #207 | Poor 4.1% |
| Immigrants | Somalia | 12.5 /100 | #208 | Poor 4.1% |
| Immigrants | Panama | 12.3 /100 | #209 | Poor 4.1% |
| Immigrants | Nigeria | 11.7 /100 | #210 | Poor 4.1% |
| Germans | 11.6 /100 | #211 | Poor 4.1% |
Demographics Similar to Dominicans by Professional Degree
In terms of professional degree, the demographic groups most similar to Dominicans are Apache (3.5%, a difference of 0.030%), Immigrants from Portugal (3.5%, a difference of 0.040%), Immigrants from Caribbean (3.5%, a difference of 0.050%), Japanese (3.5%, a difference of 0.080%), and Cheyenne (3.6%, a difference of 0.13%).
| Demographics | Rating | Rank | Professional Degree |
| Americans | 0.5 /100 | #273 | Tragic 3.6% |
| Potawatomi | 0.5 /100 | #274 | Tragic 3.6% |
| Immigrants | Dominica | 0.5 /100 | #275 | Tragic 3.6% |
| Liberians | 0.5 /100 | #276 | Tragic 3.6% |
| Cheyenne | 0.5 /100 | #277 | Tragic 3.6% |
| Japanese | 0.5 /100 | #278 | Tragic 3.5% |
| Immigrants | Portugal | 0.5 /100 | #279 | Tragic 3.5% |
| Dominicans | 0.5 /100 | #280 | Tragic 3.5% |
| Apache | 0.5 /100 | #281 | Tragic 3.5% |
| Immigrants | Caribbean | 0.5 /100 | #282 | Tragic 3.5% |
| Comanche | 0.4 /100 | #283 | Tragic 3.5% |
| Salvadorans | 0.4 /100 | #284 | Tragic 3.5% |
| Hondurans | 0.3 /100 | #285 | Tragic 3.5% |
| Haitians | 0.3 /100 | #286 | Tragic 3.5% |
| Immigrants | El Salvador | 0.3 /100 | #287 | Tragic 3.5% |