Immigrants from Sweden vs Potawatomi 12th Grade, No Diploma
COMPARE
Immigrants from Sweden
Potawatomi
12th Grade, No Diploma
12th Grade, No Diploma Comparison
Immigrants from Sweden
Potawatomi
92.8%
12TH GRADE, NO DIPLOMA
99.8/ 100
METRIC RATING
52nd/ 347
METRIC RANK
91.0%
12TH GRADE, NO DIPLOMA
32.9/ 100
METRIC RATING
187th/ 347
METRIC RANK
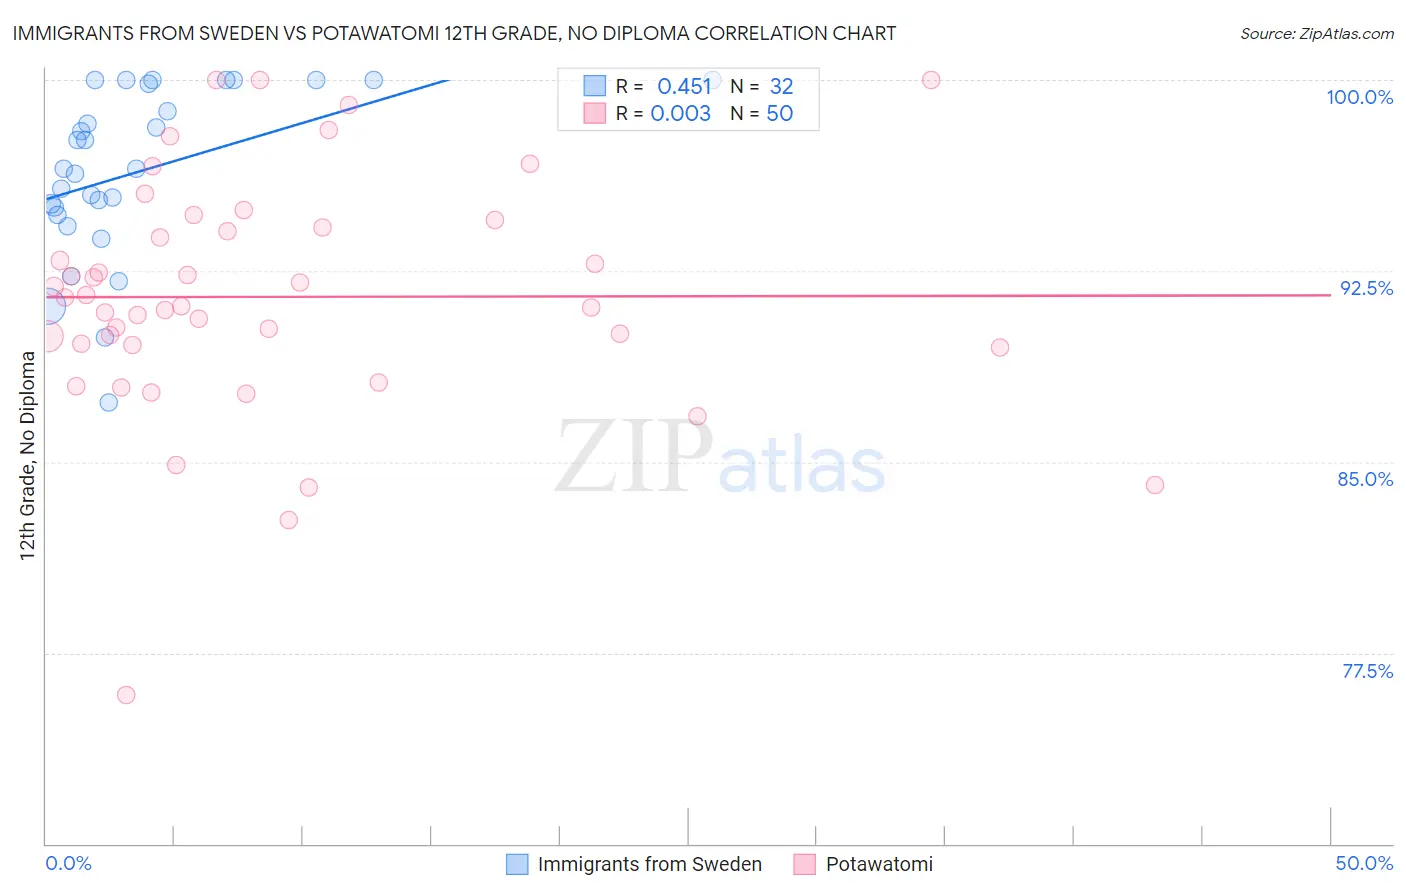
Immigrants from Sweden vs Potawatomi 12th Grade, No Diploma Correlation Chart
The statistical analysis conducted on geographies consisting of 164,736,894 people shows a moderate positive correlation between the proportion of Immigrants from Sweden and percentage of population with at least 12th grade (no diploma) education in the United States with a correlation coefficient (R) of 0.451 and weighted average of 92.8%. Similarly, the statistical analysis conducted on geographies consisting of 117,774,178 people shows no correlation between the proportion of Potawatomi and percentage of population with at least 12th grade (no diploma) education in the United States with a correlation coefficient (R) of 0.003 and weighted average of 91.0%, a difference of 2.1%.
12th Grade, No Diploma Correlation Summary
| Measurement | Immigrants from Sweden | Potawatomi |
| Minimum | 87.3% | 75.9% |
| Maximum | 100.0% | 100.0% |
| Range | 12.7% | 24.1% |
| Mean | 96.4% | 91.5% |
| Median | 96.5% | 91.3% |
| Interquartile 25% (IQ1) | 94.8% | 89.6% |
| Interquartile 75% (IQ3) | 99.9% | 94.2% |
| Interquartile Range (IQR) | 5.1% | 4.6% |
| Standard Deviation (Sample) | 3.3% | 4.7% |
| Standard Deviation (Population) | 3.3% | 4.6% |
Similar Demographics by 12th Grade, No Diploma
Demographics Similar to Immigrants from Sweden by 12th Grade, No Diploma
In terms of 12th grade, no diploma, the demographic groups most similar to Immigrants from Sweden are Tsimshian (92.9%, a difference of 0.010%), Immigrants from Belgium (92.9%, a difference of 0.010%), Serbian (92.8%, a difference of 0.010%), Hungarian (92.8%, a difference of 0.010%), and Welsh (92.8%, a difference of 0.020%).
| Demographics | Rating | Rank | 12th Grade, No Diploma |
| Greeks | 99.8 /100 | #45 | Exceptional 92.9% |
| British | 99.8 /100 | #46 | Exceptional 92.9% |
| Belgians | 99.8 /100 | #47 | Exceptional 92.9% |
| Australians | 99.8 /100 | #48 | Exceptional 92.9% |
| Macedonians | 99.8 /100 | #49 | Exceptional 92.9% |
| Tsimshian | 99.8 /100 | #50 | Exceptional 92.9% |
| Immigrants | Belgium | 99.8 /100 | #51 | Exceptional 92.9% |
| Immigrants | Sweden | 99.8 /100 | #52 | Exceptional 92.8% |
| Serbians | 99.7 /100 | #53 | Exceptional 92.8% |
| Hungarians | 99.7 /100 | #54 | Exceptional 92.8% |
| Welsh | 99.7 /100 | #55 | Exceptional 92.8% |
| New Zealanders | 99.7 /100 | #56 | Exceptional 92.8% |
| Immigrants | Canada | 99.7 /100 | #57 | Exceptional 92.8% |
| Immigrants | Taiwan | 99.7 /100 | #58 | Exceptional 92.8% |
| Immigrants | North America | 99.7 /100 | #59 | Exceptional 92.8% |
Demographics Similar to Potawatomi by 12th Grade, No Diploma
In terms of 12th grade, no diploma, the demographic groups most similar to Potawatomi are American (91.0%, a difference of 0.0%), Ethiopian (91.0%, a difference of 0.010%), Sudanese (91.0%, a difference of 0.020%), Immigrants from Uganda (90.9%, a difference of 0.020%), and Afghan (90.9%, a difference of 0.040%).
| Demographics | Rating | Rank | 12th Grade, No Diploma |
| Immigrants | Syria | 40.3 /100 | #180 | Average 91.1% |
| Guamanians/Chamorros | 39.5 /100 | #181 | Fair 91.0% |
| Immigrants | Nonimmigrants | 38.8 /100 | #182 | Fair 91.0% |
| Osage | 38.3 /100 | #183 | Fair 91.0% |
| Spaniards | 36.2 /100 | #184 | Fair 91.0% |
| Sudanese | 34.4 /100 | #185 | Fair 91.0% |
| Ethiopians | 33.9 /100 | #186 | Fair 91.0% |
| Potawatomi | 32.9 /100 | #187 | Fair 91.0% |
| Americans | 32.6 /100 | #188 | Fair 91.0% |
| Immigrants | Uganda | 31.6 /100 | #189 | Fair 90.9% |
| Afghans | 29.9 /100 | #190 | Fair 90.9% |
| Moroccans | 28.8 /100 | #191 | Fair 90.9% |
| Immigrants | Eastern Africa | 27.7 /100 | #192 | Fair 90.9% |
| Immigrants | Ethiopia | 27.2 /100 | #193 | Fair 90.9% |
| Immigrants | Oceania | 26.0 /100 | #194 | Fair 90.9% |