Immigrants from Indonesia vs Potawatomi 12th Grade, No Diploma
COMPARE
Immigrants from Indonesia
Potawatomi
12th Grade, No Diploma
12th Grade, No Diploma Comparison
Immigrants from Indonesia
Potawatomi
91.2%
12TH GRADE, NO DIPLOMA
54.9/ 100
METRIC RATING
169th/ 347
METRIC RANK
91.0%
12TH GRADE, NO DIPLOMA
32.9/ 100
METRIC RATING
187th/ 347
METRIC RANK
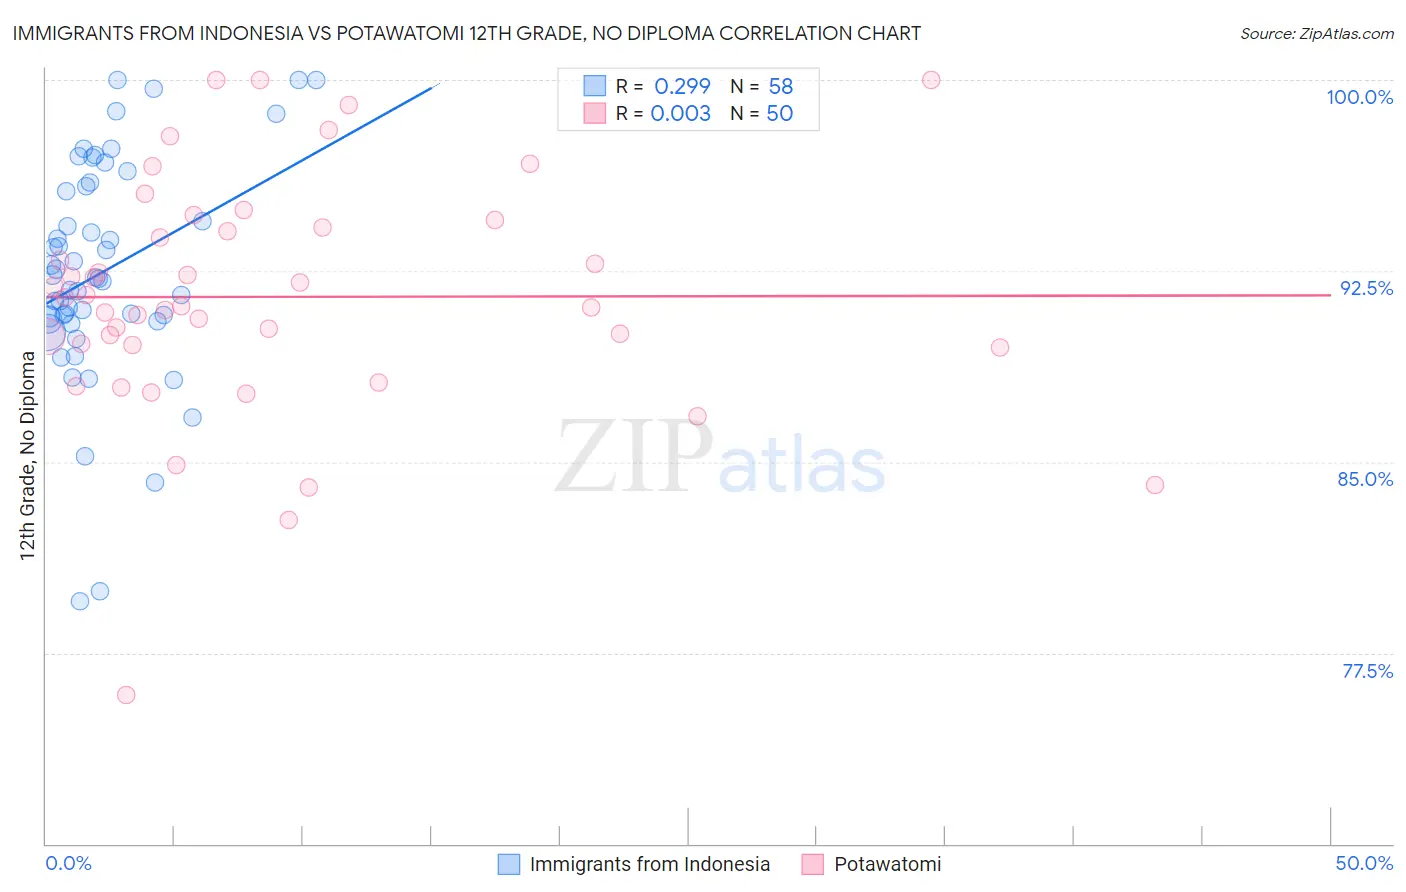
Immigrants from Indonesia vs Potawatomi 12th Grade, No Diploma Correlation Chart
The statistical analysis conducted on geographies consisting of 215,765,946 people shows a weak positive correlation between the proportion of Immigrants from Indonesia and percentage of population with at least 12th grade (no diploma) education in the United States with a correlation coefficient (R) of 0.299 and weighted average of 91.2%. Similarly, the statistical analysis conducted on geographies consisting of 117,774,178 people shows no correlation between the proportion of Potawatomi and percentage of population with at least 12th grade (no diploma) education in the United States with a correlation coefficient (R) of 0.003 and weighted average of 91.0%, a difference of 0.28%.
12th Grade, No Diploma Correlation Summary
| Measurement | Immigrants from Indonesia | Potawatomi |
| Minimum | 79.5% | 75.9% |
| Maximum | 100.0% | 100.0% |
| Range | 20.5% | 24.1% |
| Mean | 92.5% | 91.5% |
| Median | 92.2% | 91.3% |
| Interquartile 25% (IQ1) | 90.6% | 89.6% |
| Interquartile 75% (IQ3) | 95.8% | 94.2% |
| Interquartile Range (IQR) | 5.3% | 4.6% |
| Standard Deviation (Sample) | 4.4% | 4.7% |
| Standard Deviation (Population) | 4.3% | 4.6% |
Demographics Similar to Immigrants from Indonesia and Potawatomi by 12th Grade, No Diploma
In terms of 12th grade, no diploma, the demographic groups most similar to Immigrants from Indonesia are Cree (91.2%, a difference of 0.030%), Delaware (91.2%, a difference of 0.030%), Immigrants from Morocco (91.2%, a difference of 0.040%), Bermudan (91.2%, a difference of 0.050%), and Bolivian (91.2%, a difference of 0.060%). Similarly, the demographic groups most similar to Potawatomi are American (91.0%, a difference of 0.0%), Ethiopian (91.0%, a difference of 0.010%), Sudanese (91.0%, a difference of 0.020%), Spaniard (91.0%, a difference of 0.050%), and Osage (91.0%, a difference of 0.070%).
| Demographics | Rating | Rank | 12th Grade, No Diploma |
| Cree | 57.0 /100 | #168 | Average 91.2% |
| Immigrants | Indonesia | 54.9 /100 | #169 | Average 91.2% |
| Delaware | 52.8 /100 | #170 | Average 91.2% |
| Immigrants | Morocco | 51.4 /100 | #171 | Average 91.2% |
| Bermudans | 50.8 /100 | #172 | Average 91.2% |
| Bolivians | 50.4 /100 | #173 | Average 91.2% |
| Immigrants | Nepal | 50.0 /100 | #174 | Average 91.2% |
| Immigrants | Western Asia | 49.0 /100 | #175 | Average 91.2% |
| Iroquois | 48.5 /100 | #176 | Average 91.1% |
| Sierra Leoneans | 47.7 /100 | #177 | Average 91.1% |
| Spanish | 43.7 /100 | #178 | Average 91.1% |
| Immigrants | Chile | 43.3 /100 | #179 | Average 91.1% |
| Immigrants | Syria | 40.3 /100 | #180 | Average 91.1% |
| Guamanians/Chamorros | 39.5 /100 | #181 | Fair 91.0% |
| Immigrants | Nonimmigrants | 38.8 /100 | #182 | Fair 91.0% |
| Osage | 38.3 /100 | #183 | Fair 91.0% |
| Spaniards | 36.2 /100 | #184 | Fair 91.0% |
| Sudanese | 34.4 /100 | #185 | Fair 91.0% |
| Ethiopians | 33.9 /100 | #186 | Fair 91.0% |
| Potawatomi | 32.9 /100 | #187 | Fair 91.0% |
| Americans | 32.6 /100 | #188 | Fair 91.0% |