Immigrants from Sweden vs Danish 2nd Grade
COMPARE
Immigrants from Sweden
Danish
2nd Grade
2nd Grade Comparison
Immigrants from Sweden
Danes
98.2%
2ND GRADE
99.1/ 100
METRIC RATING
83rd/ 347
METRIC RANK
98.5%
2ND GRADE
100.0/ 100
METRIC RATING
23rd/ 347
METRIC RANK
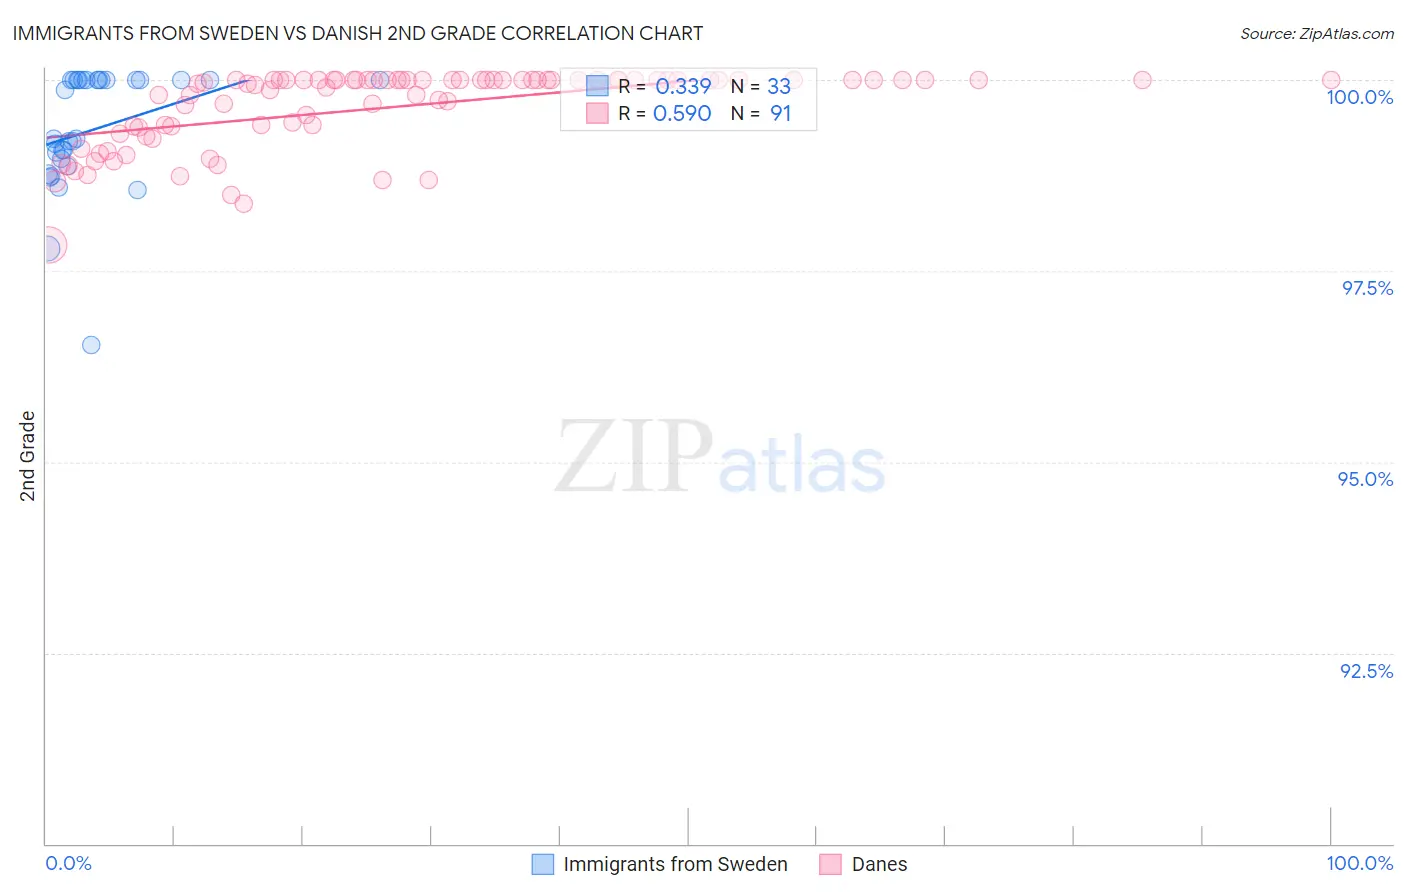
Immigrants from Sweden vs Danish 2nd Grade Correlation Chart
The statistical analysis conducted on geographies consisting of 164,737,092 people shows a mild positive correlation between the proportion of Immigrants from Sweden and percentage of population with at least 2nd grade education in the United States with a correlation coefficient (R) of 0.339 and weighted average of 98.2%. Similarly, the statistical analysis conducted on geographies consisting of 474,193,610 people shows a substantial positive correlation between the proportion of Danes and percentage of population with at least 2nd grade education in the United States with a correlation coefficient (R) of 0.590 and weighted average of 98.5%, a difference of 0.32%.
2nd Grade Correlation Summary
| Measurement | Immigrants from Sweden | Danish |
| Minimum | 96.5% | 97.8% |
| Maximum | 100.0% | 100.0% |
| Range | 3.5% | 2.2% |
| Mean | 99.4% | 99.6% |
| Median | 99.2% | 100.0% |
| Interquartile 25% (IQ1) | 98.9% | 99.4% |
| Interquartile 75% (IQ3) | 100.0% | 100.0% |
| Interquartile Range (IQR) | 1.1% | 0.63% |
| Standard Deviation (Sample) | 0.79% | 0.51% |
| Standard Deviation (Population) | 0.78% | 0.50% |
Similar Demographics by 2nd Grade
Demographics Similar to Immigrants from Sweden by 2nd Grade
In terms of 2nd grade, the demographic groups most similar to Immigrants from Sweden are Delaware (98.2%, a difference of 0.0%), Hopi (98.2%, a difference of 0.0%), Potawatomi (98.2%, a difference of 0.0%), Osage (98.2%, a difference of 0.010%), and Icelander (98.2%, a difference of 0.010%).
| Demographics | Rating | Rank | 2nd Grade |
| Cherokee | 99.4 /100 | #76 | Exceptional 98.3% |
| Immigrants | England | 99.4 /100 | #77 | Exceptional 98.3% |
| Immigrants | Lithuania | 99.3 /100 | #78 | Exceptional 98.2% |
| Immigrants | Belgium | 99.3 /100 | #79 | Exceptional 98.2% |
| Osage | 99.2 /100 | #80 | Exceptional 98.2% |
| Icelanders | 99.2 /100 | #81 | Exceptional 98.2% |
| Delaware | 99.1 /100 | #82 | Exceptional 98.2% |
| Immigrants | Sweden | 99.1 /100 | #83 | Exceptional 98.2% |
| Hopi | 99.1 /100 | #84 | Exceptional 98.2% |
| Potawatomi | 99.1 /100 | #85 | Exceptional 98.2% |
| Immigrants | Australia | 99.0 /100 | #86 | Exceptional 98.2% |
| Immigrants | Denmark | 99.0 /100 | #87 | Exceptional 98.2% |
| Macedonians | 99.0 /100 | #88 | Exceptional 98.2% |
| Ukrainians | 98.9 /100 | #89 | Exceptional 98.2% |
| Zimbabweans | 98.8 /100 | #90 | Exceptional 98.2% |
Demographics Similar to Danes by 2nd Grade
In terms of 2nd grade, the demographic groups most similar to Danes are Finnish (98.5%, a difference of 0.0%), Sioux (98.5%, a difference of 0.0%), Lithuanian (98.5%, a difference of 0.0%), Polish (98.5%, a difference of 0.0%), and Pennsylvania German (98.5%, a difference of 0.0%).
| Demographics | Rating | Rank | 2nd Grade |
| Dutch | 100.0 /100 | #16 | Exceptional 98.6% |
| Aleuts | 100.0 /100 | #17 | Exceptional 98.6% |
| Irish | 100.0 /100 | #18 | Exceptional 98.6% |
| Finns | 100.0 /100 | #19 | Exceptional 98.5% |
| Sioux | 100.0 /100 | #20 | Exceptional 98.5% |
| Lithuanians | 100.0 /100 | #21 | Exceptional 98.5% |
| Poles | 100.0 /100 | #22 | Exceptional 98.5% |
| Danes | 100.0 /100 | #23 | Exceptional 98.5% |
| Pennsylvania Germans | 100.0 /100 | #24 | Exceptional 98.5% |
| Scotch-Irish | 100.0 /100 | #25 | Exceptional 98.5% |
| Welsh | 100.0 /100 | #26 | Exceptional 98.5% |
| Croatians | 100.0 /100 | #27 | Exceptional 98.5% |
| Arapaho | 100.0 /100 | #28 | Exceptional 98.5% |
| French | 100.0 /100 | #29 | Exceptional 98.5% |
| Europeans | 100.0 /100 | #30 | Exceptional 98.5% |