Immigrants from Spain vs Taiwanese High School Diploma
COMPARE
Immigrants from Spain
Taiwanese
High School Diploma
High School Diploma Comparison
Immigrants from Spain
Taiwanese
89.5%
HIGH SCHOOL DIPLOMA
76.2/ 100
METRIC RATING
146th/ 347
METRIC RANK
87.9%
HIGH SCHOOL DIPLOMA
2.8/ 100
METRIC RATING
237th/ 347
METRIC RANK
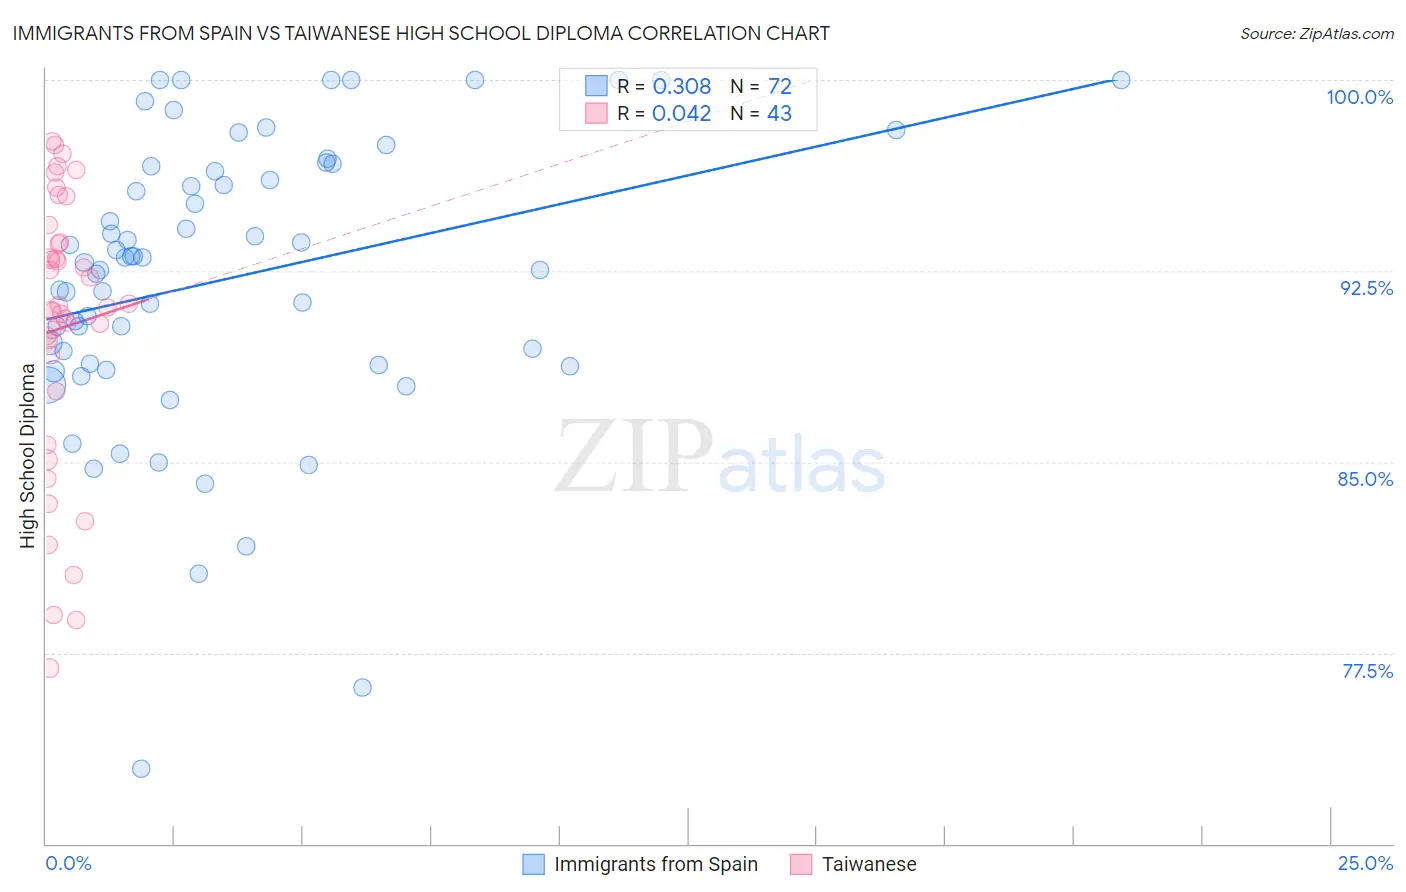
Immigrants from Spain vs Taiwanese High School Diploma Correlation Chart
The statistical analysis conducted on geographies consisting of 239,682,725 people shows a mild positive correlation between the proportion of Immigrants from Spain and percentage of population with at least high school diploma education in the United States with a correlation coefficient (R) of 0.308 and weighted average of 89.5%. Similarly, the statistical analysis conducted on geographies consisting of 31,677,387 people shows no correlation between the proportion of Taiwanese and percentage of population with at least high school diploma education in the United States with a correlation coefficient (R) of 0.042 and weighted average of 87.9%, a difference of 1.8%.
High School Diploma Correlation Summary
| Measurement | Immigrants from Spain | Taiwanese |
| Minimum | 72.9% | 76.9% |
| Maximum | 100.0% | 97.6% |
| Range | 27.1% | 20.7% |
| Mean | 92.2% | 90.3% |
| Median | 92.9% | 91.1% |
| Interquartile 25% (IQ1) | 88.8% | 87.8% |
| Interquartile 75% (IQ3) | 96.5% | 93.6% |
| Interquartile Range (IQR) | 7.7% | 5.8% |
| Standard Deviation (Sample) | 5.6% | 5.4% |
| Standard Deviation (Population) | 5.6% | 5.4% |
Similar Demographics by High School Diploma
Demographics Similar to Immigrants from Spain by High School Diploma
In terms of high school diploma, the demographic groups most similar to Immigrants from Spain are Immigrants from Brazil (89.5%, a difference of 0.010%), Immigrants from Kenya (89.6%, a difference of 0.040%), Pakistani (89.6%, a difference of 0.050%), Iraqi (89.5%, a difference of 0.050%), and Chilean (89.6%, a difference of 0.060%).
| Demographics | Rating | Rank | High School Diploma |
| Kenyans | 81.4 /100 | #139 | Excellent 89.6% |
| Immigrants | Egypt | 81.2 /100 | #140 | Excellent 89.6% |
| Chileans | 79.0 /100 | #141 | Good 89.6% |
| Indians (Asian) | 78.8 /100 | #142 | Good 89.6% |
| Pakistanis | 78.3 /100 | #143 | Good 89.6% |
| Immigrants | Kenya | 78.0 /100 | #144 | Good 89.6% |
| Immigrants | Brazil | 76.6 /100 | #145 | Good 89.5% |
| Immigrants | Spain | 76.2 /100 | #146 | Good 89.5% |
| Iraqis | 73.9 /100 | #147 | Good 89.5% |
| Immigrants | Lebanon | 73.4 /100 | #148 | Good 89.5% |
| Immigrants | Poland | 72.9 /100 | #149 | Good 89.5% |
| Argentineans | 72.3 /100 | #150 | Good 89.5% |
| Paraguayans | 71.4 /100 | #151 | Good 89.5% |
| Asians | 70.7 /100 | #152 | Good 89.4% |
| Immigrants | Iraq | 68.7 /100 | #153 | Good 89.4% |
Demographics Similar to Taiwanese by High School Diploma
In terms of high school diploma, the demographic groups most similar to Taiwanese are Sioux (87.9%, a difference of 0.0%), South American (87.9%, a difference of 0.0%), Subsaharan African (87.9%, a difference of 0.010%), Immigrants from Bahamas (88.0%, a difference of 0.030%), and Immigrants from Thailand (88.0%, a difference of 0.040%).
| Demographics | Rating | Rank | High School Diploma |
| Blackfeet | 4.2 /100 | #230 | Tragic 88.1% |
| Colombians | 3.8 /100 | #231 | Tragic 88.1% |
| Immigrants | Middle Africa | 3.4 /100 | #232 | Tragic 88.0% |
| Immigrants | Panama | 3.1 /100 | #233 | Tragic 88.0% |
| Immigrants | Thailand | 3.1 /100 | #234 | Tragic 88.0% |
| Immigrants | Bahamas | 2.9 /100 | #235 | Tragic 88.0% |
| Sub-Saharan Africans | 2.8 /100 | #236 | Tragic 87.9% |
| Taiwanese | 2.8 /100 | #237 | Tragic 87.9% |
| Sioux | 2.7 /100 | #238 | Tragic 87.9% |
| South Americans | 2.7 /100 | #239 | Tragic 87.9% |
| Comanche | 2.2 /100 | #240 | Tragic 87.9% |
| Immigrants | Uzbekistan | 2.1 /100 | #241 | Tragic 87.8% |
| Cheyenne | 2.1 /100 | #242 | Tragic 87.8% |
| Immigrants | Philippines | 1.9 /100 | #243 | Tragic 87.8% |
| Choctaw | 1.9 /100 | #244 | Tragic 87.8% |