Immigrants from South Eastern Asia vs Nepalese Doctorate Degree
COMPARE
Immigrants from South Eastern Asia
Nepalese
Doctorate Degree
Doctorate Degree Comparison
Immigrants from South Eastern Asia
Nepalese
1.7%
DOCTORATE DEGREE
14.7/ 100
METRIC RATING
212th/ 347
METRIC RANK
1.3%
DOCTORATE DEGREE
0.0/ 100
METRIC RATING
336th/ 347
METRIC RANK
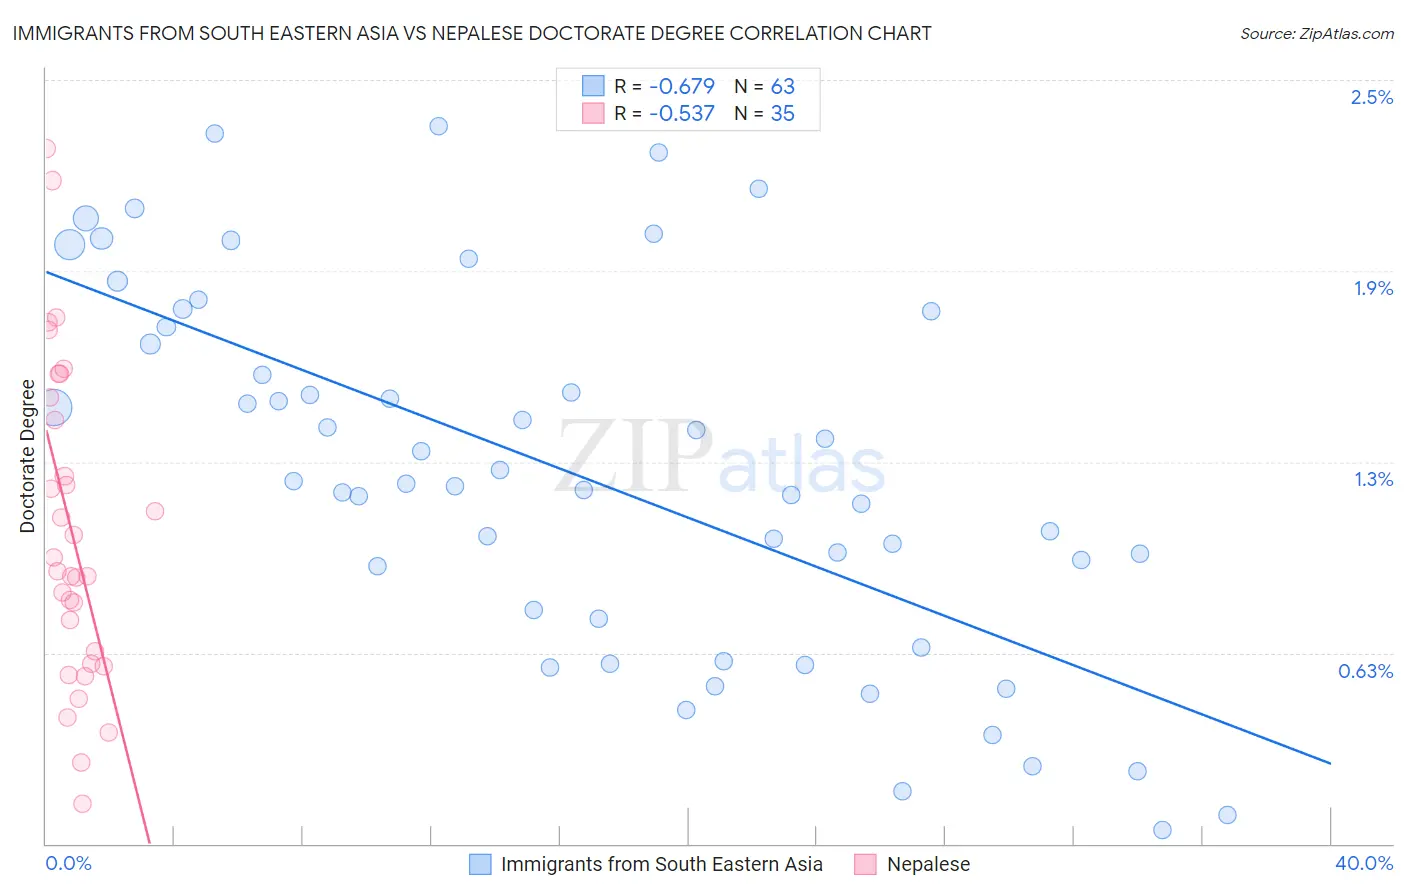
Immigrants from South Eastern Asia vs Nepalese Doctorate Degree Correlation Chart
The statistical analysis conducted on geographies consisting of 502,144,832 people shows a significant negative correlation between the proportion of Immigrants from South Eastern Asia and percentage of population with at least doctorate degree education in the United States with a correlation coefficient (R) of -0.679 and weighted average of 1.7%. Similarly, the statistical analysis conducted on geographies consisting of 24,454,605 people shows a substantial negative correlation between the proportion of Nepalese and percentage of population with at least doctorate degree education in the United States with a correlation coefficient (R) of -0.537 and weighted average of 1.3%, a difference of 37.2%.
Doctorate Degree Correlation Summary
| Measurement | Immigrants from South Eastern Asia | Nepalese |
| Minimum | 0.043% | 0.13% |
| Maximum | 2.3% | 2.3% |
| Range | 2.3% | 2.1% |
| Mean | 1.2% | 1.0% |
| Median | 1.2% | 0.89% |
| Interquartile 25% (IQ1) | 0.74% | 0.59% |
| Interquartile 75% (IQ3) | 1.7% | 1.5% |
| Interquartile Range (IQR) | 0.96% | 0.87% |
| Standard Deviation (Sample) | 0.60% | 0.52% |
| Standard Deviation (Population) | 0.59% | 0.51% |
Similar Demographics by Doctorate Degree
Demographics Similar to Immigrants from South Eastern Asia by Doctorate Degree
In terms of doctorate degree, the demographic groups most similar to Immigrants from South Eastern Asia are Immigrants from Armenia (1.7%, a difference of 0.13%), Tongan (1.7%, a difference of 0.14%), Korean (1.7%, a difference of 0.15%), Pueblo (1.7%, a difference of 0.15%), and Immigrants from Western Africa (1.7%, a difference of 0.22%).
| Demographics | Rating | Rank | Doctorate Degree |
| Venezuelans | 19.5 /100 | #205 | Poor 1.7% |
| Immigrants | Peru | 17.6 /100 | #206 | Poor 1.7% |
| Yugoslavians | 17.1 /100 | #207 | Poor 1.7% |
| Colombians | 16.1 /100 | #208 | Poor 1.7% |
| Immigrants | Western Africa | 15.4 /100 | #209 | Poor 1.7% |
| Tongans | 15.1 /100 | #210 | Poor 1.7% |
| Immigrants | Armenia | 15.1 /100 | #211 | Poor 1.7% |
| Immigrants | South Eastern Asia | 14.7 /100 | #212 | Poor 1.7% |
| Koreans | 14.2 /100 | #213 | Poor 1.7% |
| Pueblo | 14.2 /100 | #214 | Poor 1.7% |
| Alaskan Athabascans | 13.8 /100 | #215 | Poor 1.7% |
| Immigrants | Burma/Myanmar | 13.5 /100 | #216 | Poor 1.7% |
| Spanish Americans | 12.9 /100 | #217 | Poor 1.7% |
| Tlingit-Haida | 11.9 /100 | #218 | Poor 1.7% |
| Immigrants | Iraq | 10.7 /100 | #219 | Poor 1.7% |
Demographics Similar to Nepalese by Doctorate Degree
In terms of doctorate degree, the demographic groups most similar to Nepalese are Immigrants from Haiti (1.3%, a difference of 0.23%), Immigrants from Dominican Republic (1.3%, a difference of 2.0%), Immigrants from Caribbean (1.3%, a difference of 2.2%), Yakama (1.3%, a difference of 2.4%), and Bangladeshi (1.2%, a difference of 3.5%).
| Demographics | Rating | Rank | Doctorate Degree |
| Haitians | 0.0 /100 | #329 | Tragic 1.3% |
| Yup'ik | 0.0 /100 | #330 | Tragic 1.3% |
| Immigrants | Latin America | 0.0 /100 | #331 | Tragic 1.3% |
| Yakama | 0.0 /100 | #332 | Tragic 1.3% |
| Immigrants | Caribbean | 0.0 /100 | #333 | Tragic 1.3% |
| Immigrants | Dominican Republic | 0.0 /100 | #334 | Tragic 1.3% |
| Immigrants | Haiti | 0.0 /100 | #335 | Tragic 1.3% |
| Nepalese | 0.0 /100 | #336 | Tragic 1.3% |
| Bangladeshis | 0.0 /100 | #337 | Tragic 1.2% |
| Puget Sound Salish | 0.0 /100 | #338 | Tragic 1.2% |
| Immigrants | Central America | 0.0 /100 | #339 | Tragic 1.2% |
| Immigrants | Cuba | 0.0 /100 | #340 | Tragic 1.2% |
| Mexicans | 0.0 /100 | #341 | Tragic 1.2% |
| Arapaho | 0.0 /100 | #342 | Tragic 1.2% |
| Fijians | 0.0 /100 | #343 | Tragic 1.1% |