Costa Rican vs Nepalese Doctorate Degree
COMPARE
Costa Rican
Nepalese
Doctorate Degree
Doctorate Degree Comparison
Costa Ricans
Nepalese
1.8%
DOCTORATE DEGREE
53.3/ 100
METRIC RATING
170th/ 347
METRIC RANK
1.3%
DOCTORATE DEGREE
0.0/ 100
METRIC RATING
336th/ 347
METRIC RANK
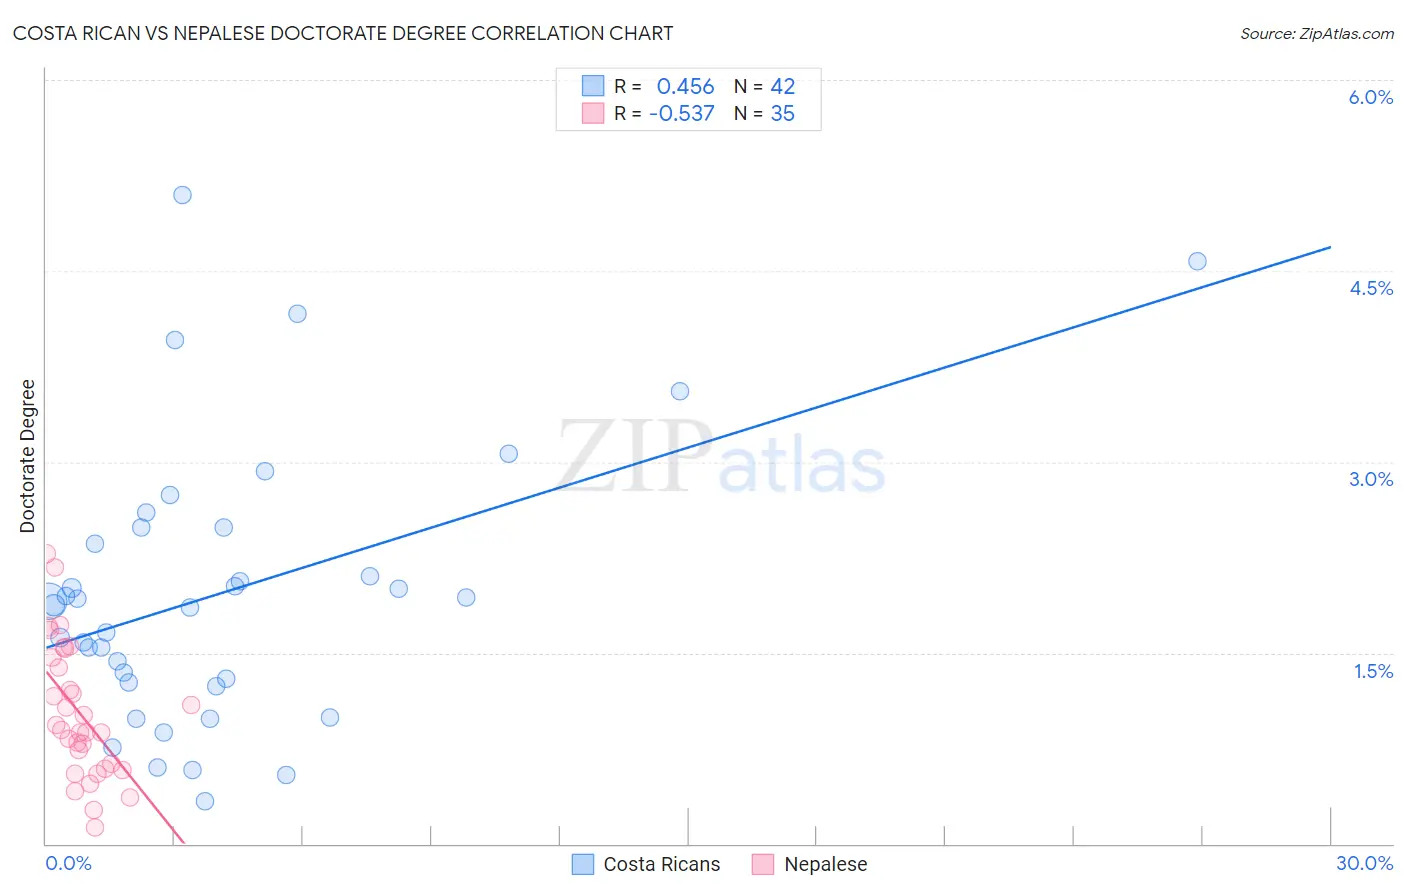
Costa Rican vs Nepalese Doctorate Degree Correlation Chart
The statistical analysis conducted on geographies consisting of 252,535,620 people shows a moderate positive correlation between the proportion of Costa Ricans and percentage of population with at least doctorate degree education in the United States with a correlation coefficient (R) of 0.456 and weighted average of 1.8%. Similarly, the statistical analysis conducted on geographies consisting of 24,454,605 people shows a substantial negative correlation between the proportion of Nepalese and percentage of population with at least doctorate degree education in the United States with a correlation coefficient (R) of -0.537 and weighted average of 1.3%, a difference of 47.4%.
Doctorate Degree Correlation Summary
| Measurement | Costa Rican | Nepalese |
| Minimum | 0.34% | 0.13% |
| Maximum | 5.1% | 2.3% |
| Range | 4.8% | 2.1% |
| Mean | 2.0% | 1.0% |
| Median | 1.9% | 0.89% |
| Interquartile 25% (IQ1) | 1.3% | 0.59% |
| Interquartile 75% (IQ3) | 2.5% | 1.5% |
| Interquartile Range (IQR) | 1.2% | 0.87% |
| Standard Deviation (Sample) | 1.1% | 0.52% |
| Standard Deviation (Population) | 1.1% | 0.51% |
Similar Demographics by Doctorate Degree
Demographics Similar to Costa Ricans by Doctorate Degree
In terms of doctorate degree, the demographic groups most similar to Costa Ricans are Bermudan (1.8%, a difference of 0.17%), Vietnamese (1.9%, a difference of 0.22%), Belgian (1.8%, a difference of 0.44%), Norwegian (1.8%, a difference of 0.48%), and Immigrants from Bangladesh (1.8%, a difference of 0.48%).
| Demographics | Rating | Rank | Doctorate Degree |
| Czechs | 67.3 /100 | #163 | Good 1.9% |
| Celtics | 66.7 /100 | #164 | Good 1.9% |
| Scotch-Irish | 63.6 /100 | #165 | Good 1.9% |
| Spaniards | 63.5 /100 | #166 | Good 1.9% |
| Macedonians | 60.9 /100 | #167 | Good 1.9% |
| Sri Lankans | 60.3 /100 | #168 | Good 1.9% |
| Vietnamese | 54.8 /100 | #169 | Average 1.9% |
| Costa Ricans | 53.3 /100 | #170 | Average 1.8% |
| Bermudans | 52.1 /100 | #171 | Average 1.8% |
| Belgians | 50.3 /100 | #172 | Average 1.8% |
| Norwegians | 50.0 /100 | #173 | Average 1.8% |
| Immigrants | Bangladesh | 50.0 /100 | #174 | Average 1.8% |
| Immigrants | Thailand | 49.4 /100 | #175 | Average 1.8% |
| Spanish | 49.3 /100 | #176 | Average 1.8% |
| Iraqis | 49.2 /100 | #177 | Average 1.8% |
Demographics Similar to Nepalese by Doctorate Degree
In terms of doctorate degree, the demographic groups most similar to Nepalese are Immigrants from Haiti (1.3%, a difference of 0.23%), Immigrants from Dominican Republic (1.3%, a difference of 2.0%), Immigrants from Caribbean (1.3%, a difference of 2.2%), Yakama (1.3%, a difference of 2.4%), and Bangladeshi (1.2%, a difference of 3.5%).
| Demographics | Rating | Rank | Doctorate Degree |
| Haitians | 0.0 /100 | #329 | Tragic 1.3% |
| Yup'ik | 0.0 /100 | #330 | Tragic 1.3% |
| Immigrants | Latin America | 0.0 /100 | #331 | Tragic 1.3% |
| Yakama | 0.0 /100 | #332 | Tragic 1.3% |
| Immigrants | Caribbean | 0.0 /100 | #333 | Tragic 1.3% |
| Immigrants | Dominican Republic | 0.0 /100 | #334 | Tragic 1.3% |
| Immigrants | Haiti | 0.0 /100 | #335 | Tragic 1.3% |
| Nepalese | 0.0 /100 | #336 | Tragic 1.3% |
| Bangladeshis | 0.0 /100 | #337 | Tragic 1.2% |
| Puget Sound Salish | 0.0 /100 | #338 | Tragic 1.2% |
| Immigrants | Central America | 0.0 /100 | #339 | Tragic 1.2% |
| Immigrants | Cuba | 0.0 /100 | #340 | Tragic 1.2% |
| Mexicans | 0.0 /100 | #341 | Tragic 1.2% |
| Arapaho | 0.0 /100 | #342 | Tragic 1.2% |
| Fijians | 0.0 /100 | #343 | Tragic 1.1% |