Immigrants from South Central Asia vs Immigrants from Russia 9th Grade
COMPARE
Immigrants from South Central Asia
Immigrants from Russia
9th Grade
9th Grade Comparison
Immigrants from South Central Asia
Immigrants from Russia
95.4%
9TH GRADE
95.1/ 100
METRIC RATING
125th/ 347
METRIC RANK
95.2%
9TH GRADE
86.6/ 100
METRIC RATING
138th/ 347
METRIC RANK
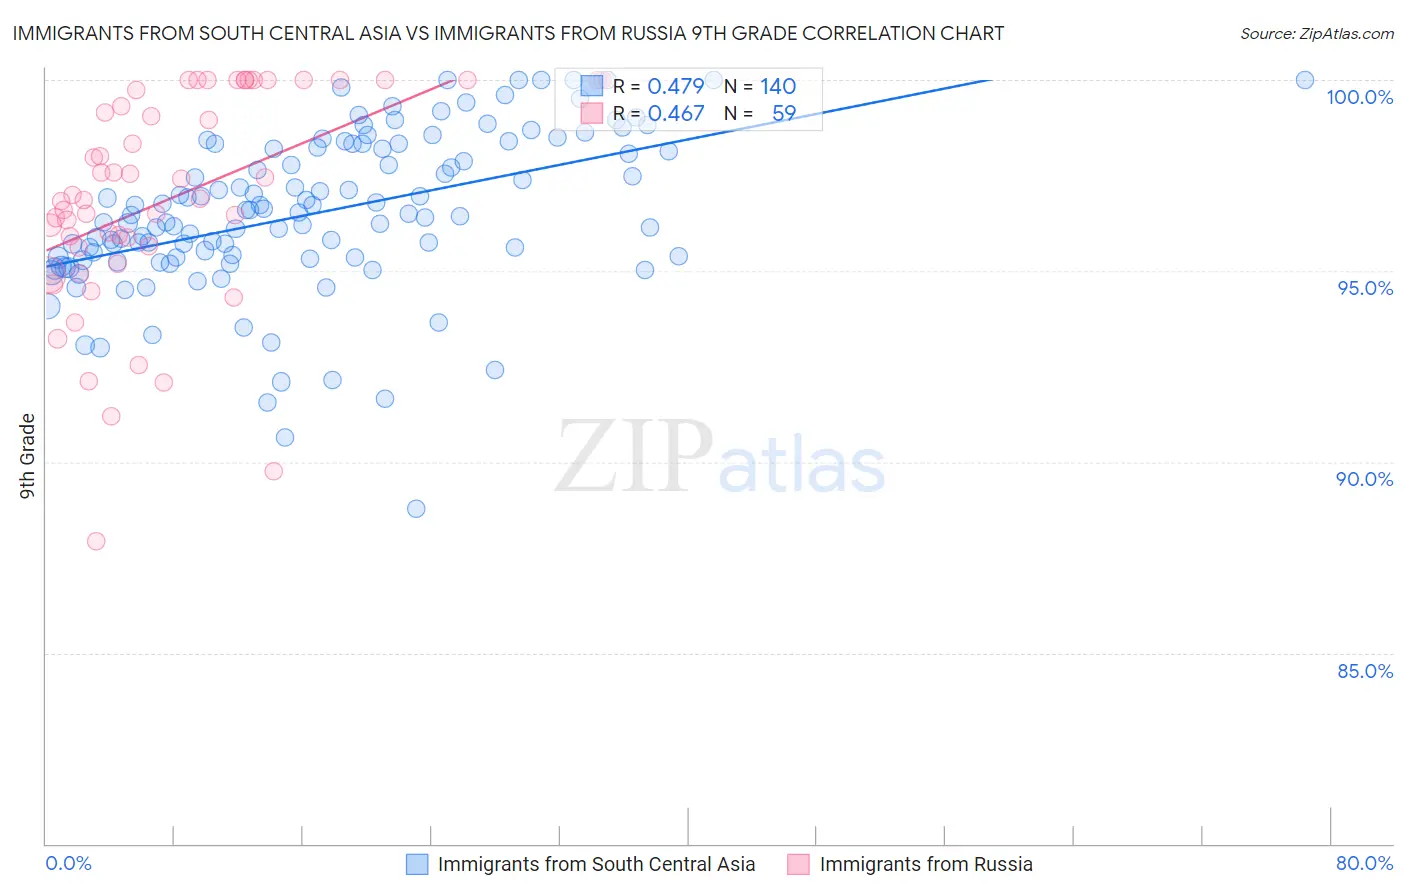
Immigrants from South Central Asia vs Immigrants from Russia 9th Grade Correlation Chart
The statistical analysis conducted on geographies consisting of 473,113,181 people shows a moderate positive correlation between the proportion of Immigrants from South Central Asia and percentage of population with at least 9th grade education in the United States with a correlation coefficient (R) of 0.479 and weighted average of 95.4%. Similarly, the statistical analysis conducted on geographies consisting of 347,948,494 people shows a moderate positive correlation between the proportion of Immigrants from Russia and percentage of population with at least 9th grade education in the United States with a correlation coefficient (R) of 0.467 and weighted average of 95.2%, a difference of 0.20%.
9th Grade Correlation Summary
| Measurement | Immigrants from South Central Asia | Immigrants from Russia |
| Minimum | 88.8% | 87.9% |
| Maximum | 100.0% | 100.0% |
| Range | 11.2% | 12.1% |
| Mean | 96.5% | 96.9% |
| Median | 96.5% | 96.9% |
| Interquartile 25% (IQ1) | 95.4% | 95.6% |
| Interquartile 75% (IQ3) | 98.2% | 100.0% |
| Interquartile Range (IQR) | 2.9% | 4.4% |
| Standard Deviation (Sample) | 2.1% | 2.8% |
| Standard Deviation (Population) | 2.1% | 2.8% |
Demographics Similar to Immigrants from South Central Asia and Immigrants from Russia by 9th Grade
In terms of 9th grade, the demographic groups most similar to Immigrants from South Central Asia are Kiowa (95.4%, a difference of 0.010%), Shoshone (95.4%, a difference of 0.010%), Cree (95.4%, a difference of 0.020%), Immigrants from Kuwait (95.4%, a difference of 0.020%), and Immigrants from Serbia (95.4%, a difference of 0.020%). Similarly, the demographic groups most similar to Immigrants from Russia are Immigrants from Eastern Europe (95.2%, a difference of 0.010%), Hmong (95.2%, a difference of 0.020%), Immigrants from Taiwan (95.2%, a difference of 0.020%), Immigrants from Bosnia and Herzegovina (95.2%, a difference of 0.020%), and Immigrants from Iran (95.2%, a difference of 0.030%).
| Demographics | Rating | Rank | 9th Grade |
| Cree | 95.5 /100 | #121 | Exceptional 95.4% |
| Immigrants | Kuwait | 95.5 /100 | #122 | Exceptional 95.4% |
| Kiowa | 95.3 /100 | #123 | Exceptional 95.4% |
| Shoshone | 95.3 /100 | #124 | Exceptional 95.4% |
| Immigrants | South Central Asia | 95.1 /100 | #125 | Exceptional 95.4% |
| Immigrants | Serbia | 94.4 /100 | #126 | Exceptional 95.4% |
| Palestinians | 94.3 /100 | #127 | Exceptional 95.4% |
| Immigrants | Hungary | 94.2 /100 | #128 | Exceptional 95.4% |
| Basques | 94.1 /100 | #129 | Exceptional 95.4% |
| Jordanians | 93.5 /100 | #130 | Exceptional 95.3% |
| Immigrants | North Macedonia | 92.3 /100 | #131 | Exceptional 95.3% |
| Immigrants | Nonimmigrants | 92.0 /100 | #132 | Exceptional 95.3% |
| Israelis | 90.4 /100 | #133 | Exceptional 95.3% |
| Immigrants | Israel | 89.6 /100 | #134 | Excellent 95.3% |
| Immigrants | Belarus | 88.9 /100 | #135 | Excellent 95.2% |
| Immigrants | Iran | 88.3 /100 | #136 | Excellent 95.2% |
| Hmong | 87.7 /100 | #137 | Excellent 95.2% |
| Immigrants | Russia | 86.6 /100 | #138 | Excellent 95.2% |
| Immigrants | Eastern Europe | 85.8 /100 | #139 | Excellent 95.2% |
| Immigrants | Taiwan | 85.3 /100 | #140 | Excellent 95.2% |
| Immigrants | Bosnia and Herzegovina | 85.2 /100 | #141 | Excellent 95.2% |