Bermudan vs Immigrants from Russia 9th Grade

COMPARE

Bermudan
Race
Ancestry
AfghanAfricanAlaska NativeAlaskan AthabascanAlbanianAleutAlsatianAmericanApacheArabArapahoArgentineanArmenianAssyrian/Chaldean/SyriacAustralianAustrianBahamianBangladeshiBarbadianBasqueBelgianBelizeanBermudanBhutaneseBlackfeetBolivianBrazilianBritishBritish West IndianBulgarianBurmeseCajunCambodianCanadianCape VerdeanCarpatho RusynCelticCentral AmericanCentral American IndianCherokeeCheyenneChickasawChileanChineseChippewaChoctawColombianColvilleComancheCosta RicanCreeCreekCroatianCrowCubanCypriotCzechCzechoslovakianDanishDelawareDominicanDutchDutch West IndianEastern EuropeanEcuadorianEgyptianEnglishEstonianEthiopianEuropeanFijianFilipinoFinnishFrenchFrench American IndianFrench CanadianGermanGerman RussianGhanaianGreekGuamanian/ChamorroGuatemalanGuyaneseHaitianHmongHonduranHopiHoumaHungarianIcelanderIndian (Asian)IndonesianInupiatIranianIraqiIrishIroquoisIsraeliItalianJamaicanJapaneseJordanianKenyanKiowaKoreanLaotianLatvianLebaneseLiberianLithuanianLumbeeLuxembourgerMacedonianMalaysianMalteseMarshalleseMenomineeMexicanMexican American IndianMongolianMoroccanNative HawaiianNavajoNepaleseNew ZealanderNicaraguanNigerianNorthern EuropeanNorwegianOkinawanOsageOttawaPaiutePakistaniPalestinianPanamanianParaguayanPennsylvania GermanPeruvianPimaPolishPortuguesePotawatomiPuebloPuerto RicanPuget Sound SalishRomanianRussianSalvadoranSamoanScandinavianScotch-IrishScottishSeminoleSenegaleseSerbianShoshoneSierra LeoneanSiouxSlavicSlovakSloveneSomaliSouth AfricanSouth AmericanSouth American IndianSoviet UnionSpaniardSpanishSpanish AmericanSpanish American IndianSri LankanSubsaharan AfricanSudaneseSwedishSwissSyrianTaiwaneseThaiTlingit-HaidaTohono O'OdhamTonganTrinidadian and TobagonianTsimshianTurkishU.S. Virgin IslanderUgandanUkrainianUruguayanUteVenezuelanVietnameseWelshWest IndianYakamaYaquiYugoslavianYumanYup'ikZimbabwean
Immigration
NonimmigrantsImmigrantsAfghanistanAfricaAlbaniaArgentinaArmeniaAsiaAustraliaAustriaBahamasBangladeshBarbadosBelarusBelgiumBelizeBoliviaBosnia and HerzegovinaBrazilBulgariaBurma/MyanmarCabo VerdeCambodiaCameroonCanadaCaribbeanCentral AmericaChileChinaColombiaCongoCosta RicaCroatiaCubaCzechoslovakiaDenmarkDominicaDominican RepublicEastern AfricaEastern AsiaEastern EuropeEcuadorEgyptEl SalvadorEnglandEritreaEthiopiaEuropeFijiFranceGermanyGhanaGreeceGrenadaGuatemalaGuyanaHaitiHondurasHong KongHungaryIndiaIndonesiaIranIraqIrelandIsraelItalyJamaicaJapanJordanKazakhstanKenyaKoreaKuwaitLaosLatin AmericaLatviaLebanonLiberiaLithuaniaMalaysiaMexicoMicronesiaMiddle AfricaMoldovaMoroccoNepalNetherlandsNicaraguaNigeriaNorth AmericaNorth MacedoniaNorthern AfricaNorthern EuropeNorwayOceaniaPakistanPanamaPeruPhilippinesPolandPortugalRomaniaSaudi ArabiaScotlandSenegalSerbiaSierra LeoneSingaporeSomaliaSouth AfricaSouth AmericaSouth Central AsiaSouth Eastern AsiaSouthern EuropeSpainSri LankaSt. Vincent and the GrenadinesSudanSwedenSwitzerlandSyriaTaiwanThailandTrinidad and TobagoTurkeyUgandaUkraineUruguayUzbekistanVenezuelaVietnamWest IndiesWestern AfricaWestern AsiaWestern EuropeYemenZaireZimbabweAzores
Immigrants from Russia
Race
Ancestry
AfghanAfricanAlaska NativeAlaskan AthabascanAlbanianAleutAlsatianAmericanApacheArabArapahoArgentineanArmenianAssyrian/Chaldean/SyriacAustralianAustrianBahamianBangladeshiBarbadianBasqueBelgianBelizeanBhutaneseBlackfeetBolivianBrazilianBritishBritish West IndianBulgarianBurmeseCajunCambodianCanadianCape VerdeanCarpatho RusynCelticCentral AmericanCentral American IndianCherokeeCheyenneChickasawChileanChineseChippewaChoctawColombianColvilleComancheCosta RicanCreeCreekCroatianCrowCubanCypriotCzechCzechoslovakianDanishDelawareDominicanDutchDutch West IndianEastern EuropeanEcuadorianEgyptianEnglishEstonianEthiopianEuropeanFijianFilipinoFinnishFrenchFrench American IndianFrench CanadianGermanGerman RussianGhanaianGreekGuamanian/ChamorroGuatemalanGuyaneseHaitianHmongHonduranHopiHoumaHungarianIcelanderIndian (Asian)IndonesianInupiatIranianIraqiIrishIroquoisIsraeliItalianJamaicanJapaneseJordanianKenyanKiowaKoreanLaotianLatvianLebaneseLiberianLithuanianLumbeeLuxembourgerMacedonianMalaysianMalteseMarshalleseMenomineeMexicanMexican American IndianMongolianMoroccanNative HawaiianNavajoNepaleseNew ZealanderNicaraguanNigerianNorthern EuropeanNorwegianOkinawanOsageOttawaPaiutePakistaniPalestinianPanamanianParaguayanPennsylvania GermanPeruvianPimaPolishPortuguesePotawatomiPuebloPuerto RicanPuget Sound SalishRomanianRussianSalvadoranSamoanScandinavianScotch-IrishScottishSeminoleSenegaleseSerbianShoshoneSierra LeoneanSiouxSlavicSlovakSloveneSomaliSouth AfricanSouth AmericanSouth American IndianSoviet UnionSpaniardSpanishSpanish AmericanSpanish American IndianSri LankanSubsaharan AfricanSudaneseSwedishSwissSyrianTaiwaneseThaiTlingit-HaidaTohono O'OdhamTonganTrinidadian and TobagonianTsimshianTurkishU.S. Virgin IslanderUgandanUkrainianUruguayanUteVenezuelanVietnameseWelshWest IndianYakamaYaquiYugoslavianYumanYup'ikZimbabwean
Immigration
NonimmigrantsImmigrantsAfghanistanAfricaAlbaniaArgentinaArmeniaAsiaAustraliaAustriaBahamasBangladeshBarbadosBelarusBelgiumBelizeBoliviaBosnia and HerzegovinaBrazilBulgariaBurma/MyanmarCabo VerdeCambodiaCameroonCanadaCaribbeanCentral AmericaChileChinaColombiaCongoCosta RicaCroatiaCubaCzechoslovakiaDenmarkDominicaDominican RepublicEastern AfricaEastern AsiaEastern EuropeEcuadorEgyptEl SalvadorEnglandEritreaEthiopiaEuropeFijiFranceGermanyGhanaGreeceGrenadaGuatemalaGuyanaHaitiHondurasHong KongHungaryIndiaIndonesiaIranIraqIrelandIsraelItalyJamaicaJapanJordanKazakhstanKenyaKoreaKuwaitLaosLatin AmericaLatviaLebanonLiberiaLithuaniaMalaysiaMexicoMicronesiaMiddle AfricaMoldovaMoroccoNepalNetherlandsNicaraguaNigeriaNorth AmericaNorth MacedoniaNorthern AfricaNorthern EuropeNorwayOceaniaPakistanPanamaPeruPhilippinesPolandPortugalRomaniaRussiaSaudi ArabiaScotlandSenegalSerbiaSierra LeoneSingaporeSomaliaSouth AfricaSouth AmericaSouth Central AsiaSouth Eastern AsiaSouthern EuropeSpainSri LankaSt. Vincent and the GrenadinesSudanSwedenSwitzerlandSyriaTaiwanThailandTrinidad and TobagoTurkeyUgandaUkraineUruguayUzbekistanVenezuelaVietnamWest IndiesWestern AfricaWestern AsiaWestern EuropeYemenZaireZimbabweAzores
9th Grade
Income
Poverty
Unemployment
Labor Participation
Family Structure
Vehicle Availability
Education Level
Disability

9th Grade Comparison

Bermudans

Immigrants from Russia

Good
Excellent
95.0%
9TH GRADE
65.8/ 100
METRIC RATING
162nd/ 347
METRIC RANK
95.2%
9TH GRADE
86.6/ 100
METRIC RATING
138th/ 347
METRIC RANK

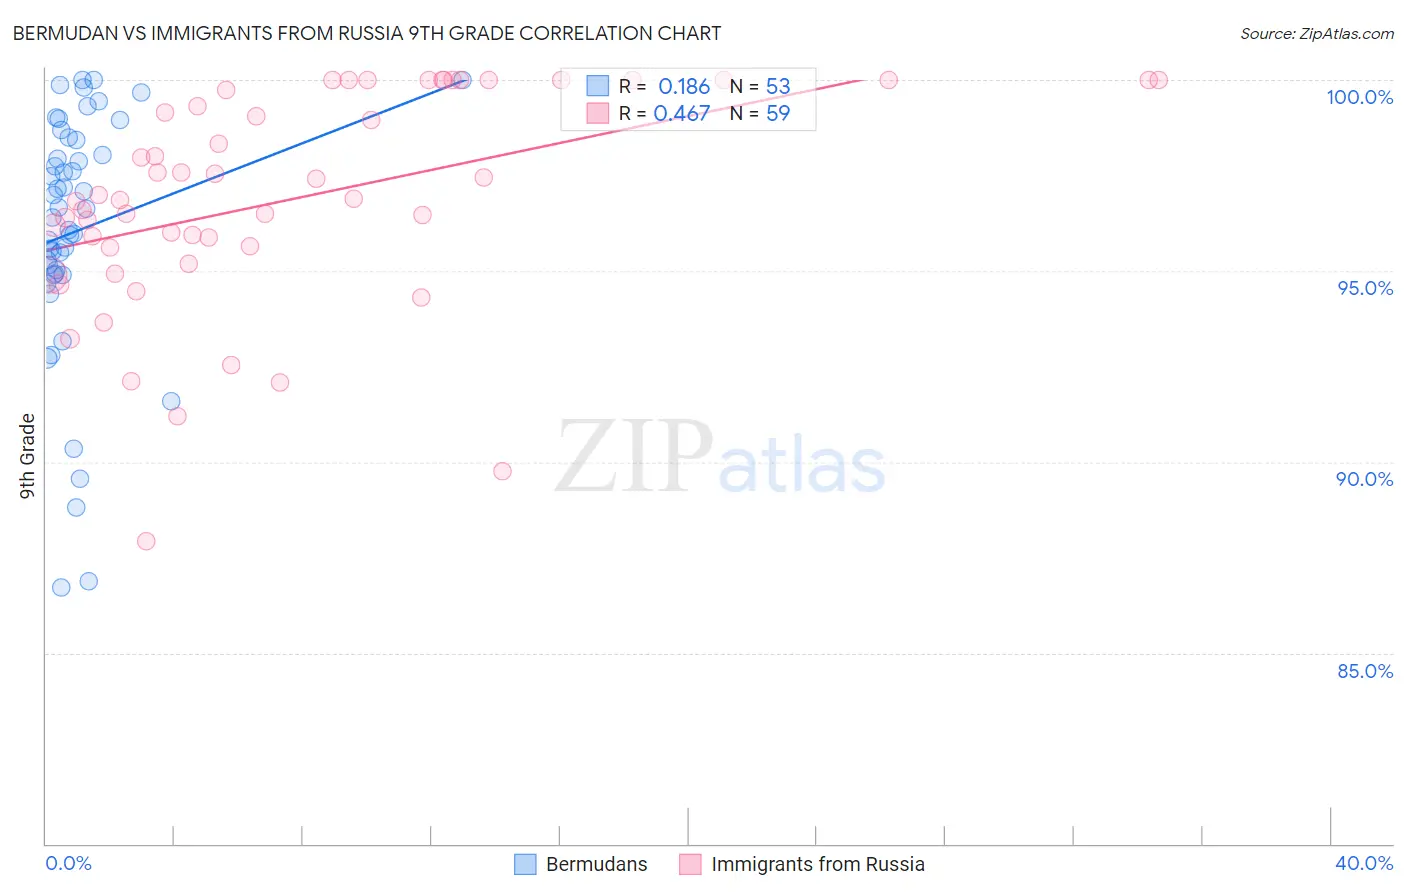
Bermudan vs Immigrants from Russia 9th Grade Correlation Chart

The statistical analysis conducted on geographies consisting of 55,732,793 people shows a poor positive correlation between the proportion of Bermudans and percentage of population with at least 9th grade education in the United States with a correlation coefficient (R) of 0.186 and weighted average of 95.0%. Similarly, the statistical analysis conducted on geographies consisting of 347,948,494 people shows a moderate positive correlation between the proportion of Immigrants from Russia and percentage of population with at least 9th grade education in the United States with a correlation coefficient (R) of 0.467 and weighted average of 95.2%, a difference of 0.22%.
Bermudan vs Immigrants from Russia 9th Grade

9th Grade Correlation Summary

MeasurementBermudanImmigrants from Russia
Minimum86.7%87.9%
Maximum100.0%100.0%
Range13.3%12.1%
Mean96.1%96.9%
Median96.6%96.9%
Interquartile 25% (IQ1)94.9%95.6%
Interquartile 75% (IQ3)98.5%100.0%
Interquartile Range (IQR)3.6%4.4%
Standard Deviation (Sample)3.2%2.8%
Standard Deviation (Population)3.2%2.8%

Similar Demographics by 9th Grade

Demographics Similar to Bermudans by 9th Grade

In terms of 9th grade, the demographic groups most similar to Bermudans are Immigrants from Ukraine (95.0%, a difference of 0.010%), Immigrants from Italy (95.0%, a difference of 0.010%), French American Indian (95.0%, a difference of 0.010%), Pakistani (95.0%, a difference of 0.010%), and Venezuelan (95.0%, a difference of 0.020%).
DemographicsRating | Rank9th Grade
Immigrants | Kazakhstan
74.7
/100
|
#155
Good
95.1%
Immigrants | Kenya
73.1
/100
|
#156
Good
95.0%
Mongolians
73.0
/100
|
#157
Good
95.0%
Egyptians
70.1
/100
|
#158
Good
95.0%
Immigrants | Ukraine
67.4
/100
|
#159
Good
95.0%
Immigrants | Italy
66.6
/100
|
#160
Good
95.0%
French American Indians
66.5
/100
|
#161
Good
95.0%
Bermudans
65.8
/100
|
#162
Good
95.0%
Pakistanis
64.1
/100
|
#163
Good
95.0%
Venezuelans
63.6
/100
|
#164
Good
95.0%
Blackfeet
62.6
/100
|
#165
Good
95.0%
Ute
62.6
/100
|
#166
Good
95.0%
Immigrants | Brazil
61.1
/100
|
#167
Good
95.0%
Chileans
60.7
/100
|
#168
Good
95.0%
Spaniards
59.6
/100
|
#169
Average
94.9%

Demographics Similar to Immigrants from Russia by 9th Grade

In terms of 9th grade, the demographic groups most similar to Immigrants from Russia are Immigrants from Eastern Europe (95.2%, a difference of 0.010%), Hmong (95.2%, a difference of 0.020%), Immigrants from Taiwan (95.2%, a difference of 0.020%), Immigrants from Bosnia and Herzegovina (95.2%, a difference of 0.020%), and Immigrants from Iran (95.2%, a difference of 0.030%).
DemographicsRating | Rank9th Grade
Immigrants | North Macedonia
92.3
/100
|
#131
Exceptional
95.3%
Immigrants | Nonimmigrants
92.0
/100
|
#132
Exceptional
95.3%
Israelis
90.4
/100
|
#133
Exceptional
95.3%
Immigrants | Israel
89.6
/100
|
#134
Excellent
95.3%
Immigrants | Belarus
88.9
/100
|
#135
Excellent
95.2%
Immigrants | Iran
88.3
/100
|
#136
Excellent
95.2%
Hmong
87.7
/100
|
#137
Excellent
95.2%
Immigrants | Russia
86.6
/100
|
#138
Excellent
95.2%
Immigrants | Eastern Europe
85.8
/100
|
#139
Excellent
95.2%
Immigrants | Taiwan
85.3
/100
|
#140
Excellent
95.2%
Immigrants | Bosnia and Herzegovina
85.2
/100
|
#141
Excellent
95.2%
Immigrants | Greece
84.6
/100
|
#142
Excellent
95.2%
Spanish
84.4
/100
|
#143
Excellent
95.2%
Yup'ik
83.3
/100
|
#144
Excellent
95.2%
Pueblo
82.2
/100
|
#145
Excellent
95.1%