Immigrants from South America vs Samoan 5th Grade

COMPARE

Immigrants from South America
Race
Ancestry
AfghanAfricanAlaska NativeAlaskan AthabascanAlbanianAleutAlsatianAmericanApacheArabArapahoArgentineanArmenianAssyrian/Chaldean/SyriacAustralianAustrianBahamianBangladeshiBarbadianBasqueBelgianBelizeanBermudanBhutaneseBlackfeetBolivianBrazilianBritishBritish West IndianBulgarianBurmeseCajunCambodianCanadianCape VerdeanCarpatho RusynCelticCentral AmericanCentral American IndianCherokeeCheyenneChickasawChileanChineseChippewaChoctawColombianColvilleComancheCosta RicanCreeCreekCroatianCrowCubanCypriotCzechCzechoslovakianDanishDelawareDominicanDutchDutch West IndianEastern EuropeanEcuadorianEgyptianEnglishEstonianEthiopianEuropeanFijianFilipinoFinnishFrenchFrench American IndianFrench CanadianGermanGerman RussianGhanaianGreekGuamanian/ChamorroGuatemalanGuyaneseHaitianHmongHonduranHopiHoumaHungarianIcelanderIndian (Asian)IndonesianInupiatIranianIraqiIrishIroquoisIsraeliItalianJamaicanJapaneseJordanianKenyanKiowaKoreanLaotianLatvianLebaneseLiberianLithuanianLumbeeLuxembourgerMacedonianMalaysianMalteseMarshalleseMenomineeMexicanMexican American IndianMongolianMoroccanNative HawaiianNavajoNepaleseNew ZealanderNicaraguanNigerianNorthern EuropeanNorwegianOkinawanOsageOttawaPaiutePakistaniPalestinianPanamanianParaguayanPennsylvania GermanPeruvianPimaPolishPortuguesePotawatomiPuebloPuerto RicanPuget Sound SalishRomanianRussianSalvadoranScandinavianScotch-IrishScottishSeminoleSenegaleseSerbianShoshoneSierra LeoneanSiouxSlavicSlovakSloveneSomaliSouth AfricanSouth AmericanSouth American IndianSoviet UnionSpaniardSpanishSpanish AmericanSpanish American IndianSri LankanSubsaharan AfricanSudaneseSwedishSwissSyrianTaiwaneseThaiTlingit-HaidaTohono O'OdhamTonganTrinidadian and TobagonianTsimshianTurkishU.S. Virgin IslanderUgandanUkrainianUruguayanUteVenezuelanVietnameseWelshWest IndianYakamaYaquiYugoslavianYumanYup'ikZimbabwean
Immigration
NonimmigrantsImmigrantsAfghanistanAfricaAlbaniaArgentinaArmeniaAsiaAustraliaAustriaBahamasBangladeshBarbadosBelarusBelgiumBelizeBoliviaBosnia and HerzegovinaBrazilBulgariaBurma/MyanmarCabo VerdeCambodiaCameroonCanadaCaribbeanCentral AmericaChileChinaColombiaCongoCosta RicaCroatiaCubaCzechoslovakiaDenmarkDominicaDominican RepublicEastern AfricaEastern AsiaEastern EuropeEcuadorEgyptEl SalvadorEnglandEritreaEthiopiaEuropeFijiFranceGermanyGhanaGreeceGrenadaGuatemalaGuyanaHaitiHondurasHong KongHungaryIndiaIndonesiaIranIraqIrelandIsraelItalyJamaicaJapanJordanKazakhstanKenyaKoreaKuwaitLaosLatin AmericaLatviaLebanonLiberiaLithuaniaMalaysiaMexicoMicronesiaMiddle AfricaMoldovaMoroccoNepalNetherlandsNicaraguaNigeriaNorth AmericaNorth MacedoniaNorthern AfricaNorthern EuropeNorwayOceaniaPakistanPanamaPeruPhilippinesPolandPortugalRomaniaRussiaSaudi ArabiaScotlandSenegalSerbiaSierra LeoneSingaporeSomaliaSouth AfricaSouth AmericaSouth Central AsiaSouth Eastern AsiaSouthern EuropeSpainSri LankaSt. Vincent and the GrenadinesSudanSwedenSwitzerlandSyriaTaiwanThailandTrinidad and TobagoTurkeyUgandaUkraineUruguayUzbekistanVenezuelaVietnamWest IndiesWestern AfricaWestern AsiaWestern EuropeYemenZaireZimbabweAzores
Samoan
Race
Ancestry
AfghanAfricanAlaska NativeAlaskan AthabascanAlbanianAleutAlsatianAmericanApacheArabArapahoArgentineanArmenianAssyrian/Chaldean/SyriacAustralianAustrianBahamianBangladeshiBarbadianBasqueBelgianBelizeanBermudanBhutaneseBlackfeetBolivianBrazilianBritishBritish West IndianBulgarianBurmeseCajunCambodianCanadianCape VerdeanCarpatho RusynCelticCentral AmericanCentral American IndianCherokeeCheyenneChickasawChileanChineseChippewaChoctawColombianColvilleComancheCosta RicanCreeCreekCroatianCrowCubanCypriotCzechCzechoslovakianDanishDelawareDominicanDutchDutch West IndianEastern EuropeanEcuadorianEgyptianEnglishEstonianEthiopianEuropeanFijianFilipinoFinnishFrenchFrench American IndianFrench CanadianGermanGerman RussianGhanaianGreekGuamanian/ChamorroGuatemalanGuyaneseHaitianHmongHonduranHopiHoumaHungarianIcelanderIndian (Asian)IndonesianInupiatIranianIraqiIrishIroquoisIsraeliItalianJamaicanJapaneseJordanianKenyanKiowaKoreanLaotianLatvianLebaneseLiberianLithuanianLumbeeLuxembourgerMacedonianMalaysianMalteseMarshalleseMenomineeMexicanMexican American IndianMongolianMoroccanNative HawaiianNavajoNepaleseNew ZealanderNicaraguanNigerianNorthern EuropeanNorwegianOkinawanOsageOttawaPaiutePakistaniPalestinianPanamanianParaguayanPennsylvania GermanPeruvianPimaPolishPortuguesePotawatomiPuebloPuerto RicanPuget Sound SalishRomanianRussianSalvadoranSamoanScandinavianScotch-IrishScottishSeminoleSenegaleseSerbianShoshoneSierra LeoneanSiouxSlavicSlovakSloveneSomaliSouth AfricanSouth AmericanSouth American IndianSoviet UnionSpaniardSpanishSpanish AmericanSpanish American IndianSri LankanSubsaharan AfricanSudaneseSwedishSwissSyrianTaiwaneseThaiTlingit-HaidaTohono O'OdhamTonganTrinidadian and TobagonianTsimshianTurkishU.S. Virgin IslanderUgandanUkrainianUruguayanUteVenezuelanVietnameseWelshWest IndianYakamaYaquiYugoslavianYumanYup'ikZimbabwean
Immigration
NonimmigrantsImmigrantsAfghanistanAfricaAlbaniaArgentinaArmeniaAsiaAustraliaAustriaBahamasBangladeshBarbadosBelarusBelgiumBelizeBoliviaBosnia and HerzegovinaBrazilBulgariaBurma/MyanmarCabo VerdeCambodiaCameroonCanadaCaribbeanCentral AmericaChileChinaColombiaCongoCosta RicaCroatiaCubaCzechoslovakiaDenmarkDominicaDominican RepublicEastern AfricaEastern AsiaEastern EuropeEcuadorEgyptEl SalvadorEnglandEritreaEthiopiaEuropeFijiFranceGermanyGhanaGreeceGrenadaGuatemalaGuyanaHaitiHondurasHong KongHungaryIndiaIndonesiaIranIraqIrelandIsraelItalyJamaicaJapanJordanKazakhstanKenyaKoreaKuwaitLaosLatin AmericaLatviaLebanonLiberiaLithuaniaMalaysiaMexicoMicronesiaMiddle AfricaMoldovaMoroccoNepalNetherlandsNicaraguaNigeriaNorth AmericaNorth MacedoniaNorthern AfricaNorthern EuropeNorwayOceaniaPakistanPanamaPeruPhilippinesPolandPortugalRomaniaRussiaSaudi ArabiaScotlandSenegalSerbiaSierra LeoneSingaporeSomaliaSouth AfricaSouth Central AsiaSouth Eastern AsiaSouthern EuropeSpainSri LankaSt. Vincent and the GrenadinesSudanSwedenSwitzerlandSyriaTaiwanThailandTrinidad and TobagoTurkeyUgandaUkraineUruguayUzbekistanVenezuelaVietnamWest IndiesWestern AfricaWestern AsiaWestern EuropeYemenZaireZimbabweAzores
5th Grade
Income
Poverty
Unemployment
Labor Participation
Family Structure
Vehicle Availability
Education Level
Disability

5th Grade Comparison

Immigrants from South America

Samoans

Tragic
Tragic
96.7%
5TH GRADE
0.3/ 100
METRIC RATING
267th/ 347
METRIC RANK
97.1%
5TH GRADE
8.5/ 100
METRIC RATING
211th/ 347
METRIC RANK

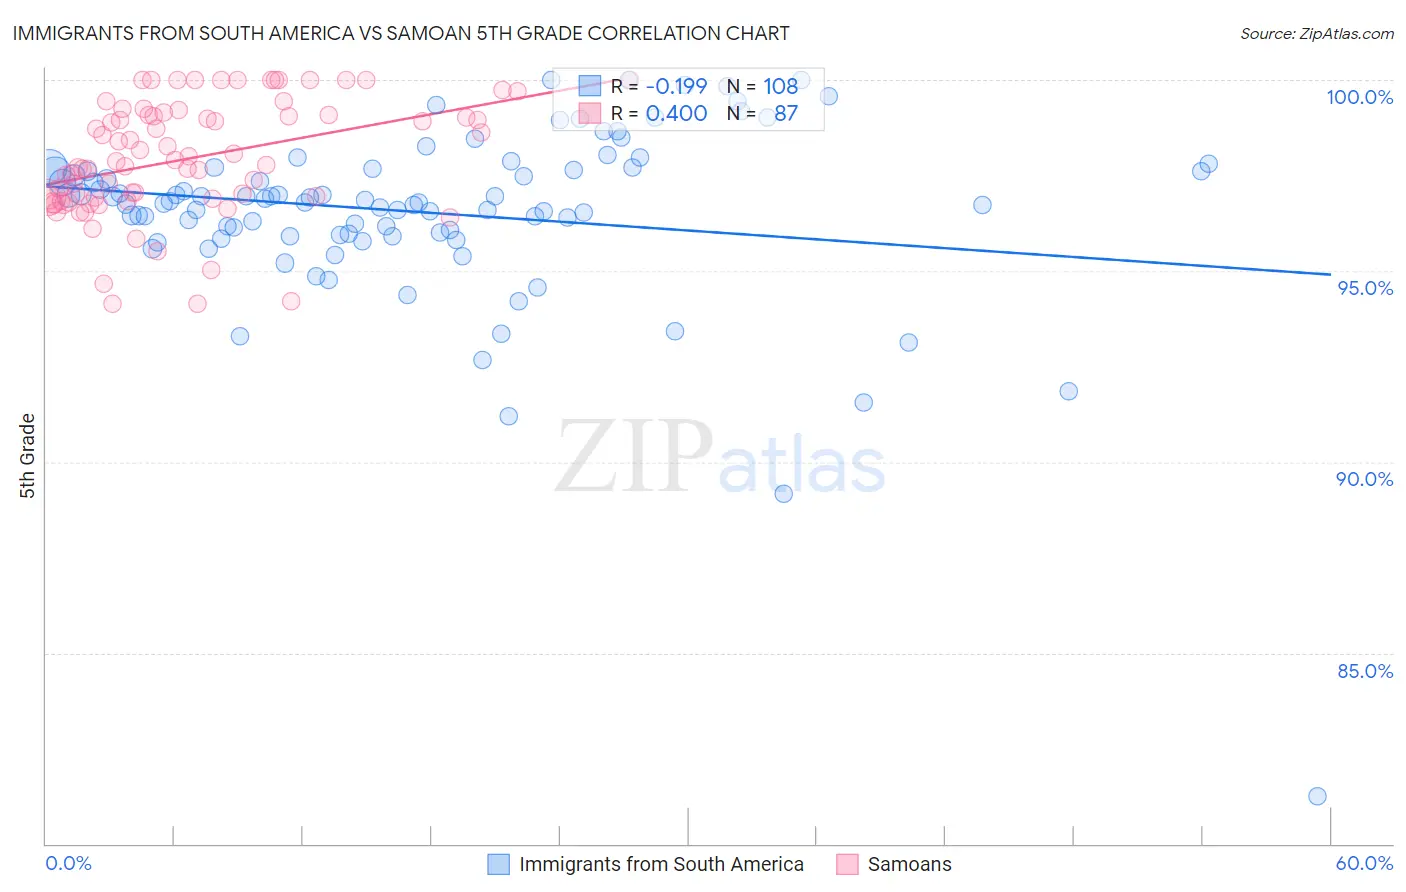
Immigrants from South America vs Samoan 5th Grade Correlation Chart

The statistical analysis conducted on geographies consisting of 486,429,751 people shows a poor negative correlation between the proportion of Immigrants from South America and percentage of population with at least 5th grade education in the United States with a correlation coefficient (R) of -0.199 and weighted average of 96.7%. Similarly, the statistical analysis conducted on geographies consisting of 225,201,909 people shows a mild positive correlation between the proportion of Samoans and percentage of population with at least 5th grade education in the United States with a correlation coefficient (R) of 0.400 and weighted average of 97.1%, a difference of 0.36%.
Immigrants from South America vs Samoan 5th Grade

5th Grade Correlation Summary

MeasurementImmigrants from South AmericaSamoan
Minimum81.2%94.1%
Maximum100.0%100.0%
Range18.8%5.9%
Mean96.5%97.9%
Median96.8%97.9%
Interquartile 25% (IQ1)96.0%96.9%
Interquartile 75% (IQ3)97.7%99.1%
Interquartile Range (IQR)1.7%2.2%
Standard Deviation (Sample)2.4%1.5%
Standard Deviation (Population)2.4%1.5%

Similar Demographics by 5th Grade

Demographics Similar to Immigrants from South America by 5th Grade

In terms of 5th grade, the demographic groups most similar to Immigrants from South America are West Indian (96.8%, a difference of 0.010%), Taiwanese (96.7%, a difference of 0.010%), Immigrants from Nigeria (96.7%, a difference of 0.010%), Armenian (96.7%, a difference of 0.010%), and Immigrants from Uzbekistan (96.8%, a difference of 0.020%).
DemographicsRating | Rank5th Grade
Immigrants | Jamaica
0.4
/100
|
#260
Tragic
96.8%
Immigrants | Sierra Leone
0.4
/100
|
#261
Tragic
96.8%
Immigrants | Colombia
0.4
/100
|
#262
Tragic
96.8%
Immigrants | Uzbekistan
0.3
/100
|
#263
Tragic
96.8%
West Indians
0.3
/100
|
#264
Tragic
96.8%
Taiwanese
0.3
/100
|
#265
Tragic
96.7%
Immigrants | Nigeria
0.3
/100
|
#266
Tragic
96.7%
Immigrants | South America
0.3
/100
|
#267
Tragic
96.7%
Armenians
0.3
/100
|
#268
Tragic
96.7%
Ghanaians
0.2
/100
|
#269
Tragic
96.7%
Afghans
0.2
/100
|
#270
Tragic
96.7%
Immigrants | Hong Kong
0.2
/100
|
#271
Tragic
96.7%
Trinidadians and Tobagonians
0.1
/100
|
#272
Tragic
96.7%
Yaqui
0.1
/100
|
#273
Tragic
96.7%
Immigrants | Cameroon
0.1
/100
|
#274
Tragic
96.7%

Demographics Similar to Samoans by 5th Grade

In terms of 5th grade, the demographic groups most similar to Samoans are Immigrants from Iraq (97.1%, a difference of 0.0%), Portuguese (97.1%, a difference of 0.010%), Costa Rican (97.1%, a difference of 0.010%), Immigrants from Morocco (97.1%, a difference of 0.010%), and Immigrants from Nepal (97.1%, a difference of 0.020%).
DemographicsRating | Rank5th Grade
Immigrants | Zaire
13.7
/100
|
#204
Poor
97.1%
Moroccans
12.0
/100
|
#205
Poor
97.1%
Paiute
11.6
/100
|
#206
Poor
97.1%
Iraqis
10.9
/100
|
#207
Poor
97.1%
Laotians
10.8
/100
|
#208
Poor
97.1%
Immigrants | Nepal
10.3
/100
|
#209
Poor
97.1%
Immigrants | Oceania
10.0
/100
|
#210
Poor
97.1%
Samoans
8.5
/100
|
#211
Tragic
97.1%
Immigrants | Iraq
8.3
/100
|
#212
Tragic
97.1%
Portuguese
7.8
/100
|
#213
Tragic
97.1%
Costa Ricans
7.7
/100
|
#214
Tragic
97.1%
Immigrants | Morocco
7.5
/100
|
#215
Tragic
97.1%
Sudanese
7.0
/100
|
#216
Tragic
97.1%
Immigrants | Lebanon
6.8
/100
|
#217
Tragic
97.1%
Immigrants | Sudan
6.5
/100
|
#218
Tragic
97.1%