Immigrants from South Africa vs Samoan 5th Grade
COMPARE
Immigrants from South Africa
Samoan
5th Grade
5th Grade Comparison
Immigrants from South Africa
Samoans
97.8%
5TH GRADE
98.8/ 100
METRIC RATING
89th/ 347
METRIC RANK
97.1%
5TH GRADE
8.5/ 100
METRIC RATING
211th/ 347
METRIC RANK
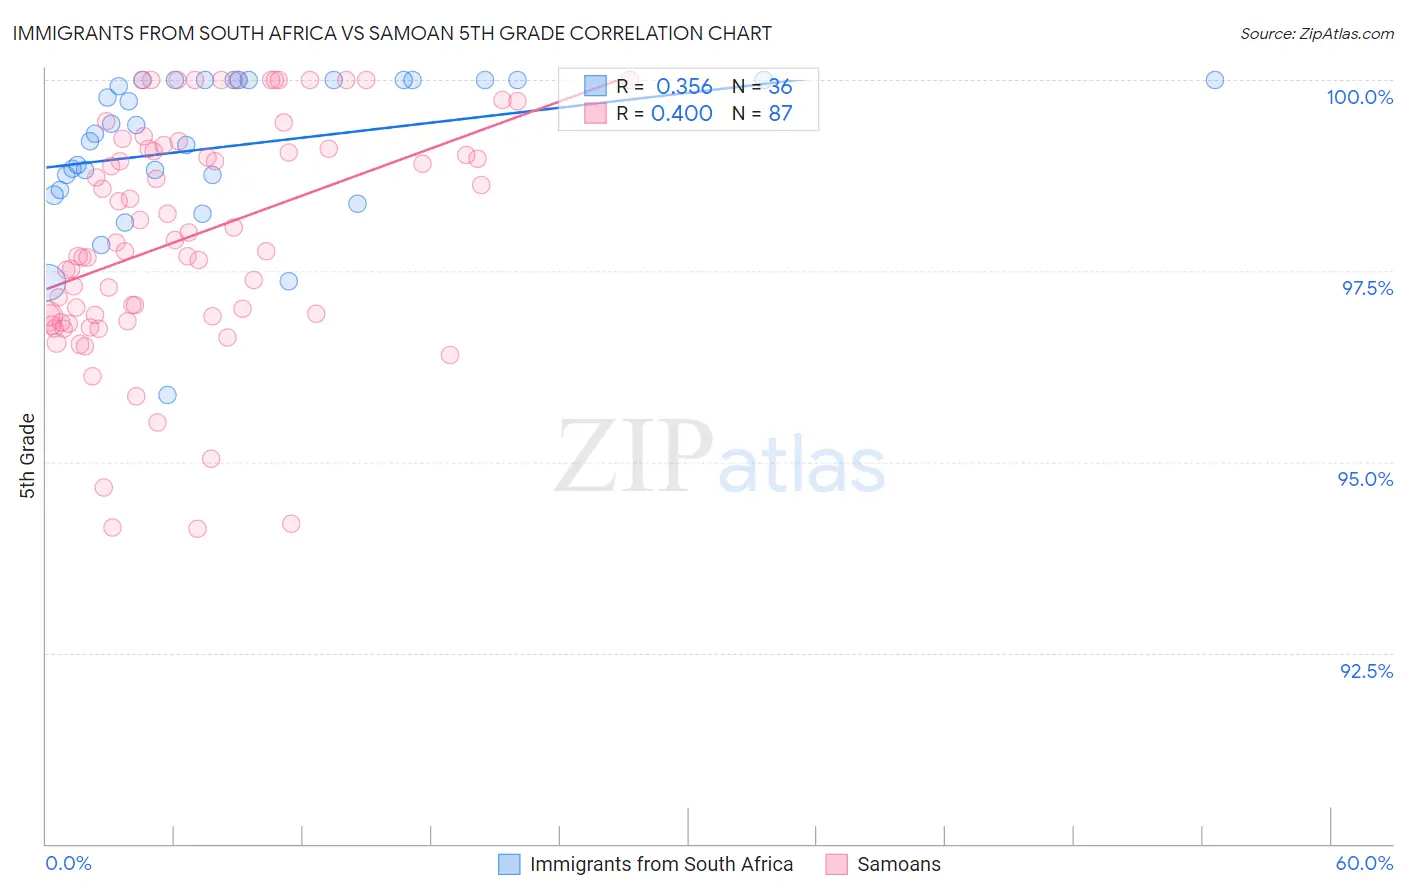
Immigrants from South Africa vs Samoan 5th Grade Correlation Chart
The statistical analysis conducted on geographies consisting of 233,321,693 people shows a mild positive correlation between the proportion of Immigrants from South Africa and percentage of population with at least 5th grade education in the United States with a correlation coefficient (R) of 0.356 and weighted average of 97.8%. Similarly, the statistical analysis conducted on geographies consisting of 225,201,909 people shows a mild positive correlation between the proportion of Samoans and percentage of population with at least 5th grade education in the United States with a correlation coefficient (R) of 0.400 and weighted average of 97.1%, a difference of 0.71%.
5th Grade Correlation Summary
| Measurement | Immigrants from South Africa | Samoan |
| Minimum | 95.9% | 94.1% |
| Maximum | 100.0% | 100.0% |
| Range | 4.1% | 5.9% |
| Mean | 99.1% | 97.9% |
| Median | 99.4% | 97.9% |
| Interquartile 25% (IQ1) | 98.7% | 96.9% |
| Interquartile 75% (IQ3) | 100.0% | 99.1% |
| Interquartile Range (IQR) | 1.3% | 2.2% |
| Standard Deviation (Sample) | 0.98% | 1.5% |
| Standard Deviation (Population) | 0.97% | 1.5% |
Similar Demographics by 5th Grade
Demographics Similar to Immigrants from South Africa by 5th Grade
In terms of 5th grade, the demographic groups most similar to Immigrants from South Africa are Immigrants from Australia (97.8%, a difference of 0.0%), Shoshone (97.8%, a difference of 0.0%), Immigrants from Ireland (97.8%, a difference of 0.0%), Immigrants from Western Europe (97.8%, a difference of 0.0%), and Cypriot (97.8%, a difference of 0.010%).
| Demographics | Rating | Rank | 5th Grade |
| Pueblo | 99.2 /100 | #82 | Exceptional 97.8% |
| Zimbabweans | 99.0 /100 | #83 | Exceptional 97.8% |
| Potawatomi | 99.0 /100 | #84 | Exceptional 97.8% |
| Immigrants | Belgium | 99.0 /100 | #85 | Exceptional 97.8% |
| Cypriots | 98.9 /100 | #86 | Exceptional 97.8% |
| Immigrants | Australia | 98.8 /100 | #87 | Exceptional 97.8% |
| Shoshone | 98.8 /100 | #88 | Exceptional 97.8% |
| Immigrants | South Africa | 98.8 /100 | #89 | Exceptional 97.8% |
| Immigrants | Ireland | 98.8 /100 | #90 | Exceptional 97.8% |
| Immigrants | Western Europe | 98.8 /100 | #91 | Exceptional 97.8% |
| Immigrants | Sweden | 98.7 /100 | #92 | Exceptional 97.8% |
| Delaware | 98.6 /100 | #93 | Exceptional 97.8% |
| Immigrants | Denmark | 98.6 /100 | #94 | Exceptional 97.8% |
| Romanians | 98.6 /100 | #95 | Exceptional 97.8% |
| Immigrants | Germany | 98.5 /100 | #96 | Exceptional 97.8% |
Demographics Similar to Samoans by 5th Grade
In terms of 5th grade, the demographic groups most similar to Samoans are Immigrants from Iraq (97.1%, a difference of 0.0%), Portuguese (97.1%, a difference of 0.010%), Costa Rican (97.1%, a difference of 0.010%), Immigrants from Morocco (97.1%, a difference of 0.010%), and Immigrants from Nepal (97.1%, a difference of 0.020%).
| Demographics | Rating | Rank | 5th Grade |
| Immigrants | Zaire | 13.7 /100 | #204 | Poor 97.1% |
| Moroccans | 12.0 /100 | #205 | Poor 97.1% |
| Paiute | 11.6 /100 | #206 | Poor 97.1% |
| Iraqis | 10.9 /100 | #207 | Poor 97.1% |
| Laotians | 10.8 /100 | #208 | Poor 97.1% |
| Immigrants | Nepal | 10.3 /100 | #209 | Poor 97.1% |
| Immigrants | Oceania | 10.0 /100 | #210 | Poor 97.1% |
| Samoans | 8.5 /100 | #211 | Tragic 97.1% |
| Immigrants | Iraq | 8.3 /100 | #212 | Tragic 97.1% |
| Portuguese | 7.8 /100 | #213 | Tragic 97.1% |
| Costa Ricans | 7.7 /100 | #214 | Tragic 97.1% |
| Immigrants | Morocco | 7.5 /100 | #215 | Tragic 97.1% |
| Sudanese | 7.0 /100 | #216 | Tragic 97.1% |
| Immigrants | Lebanon | 6.8 /100 | #217 | Tragic 97.1% |
| Immigrants | Sudan | 6.5 /100 | #218 | Tragic 97.1% |