Immigrants from South America vs British West Indian Kindergarten
COMPARE
Immigrants from South America
British West Indian
Kindergarten
Kindergarten Comparison
Immigrants from South America
British West Indians
97.5%
KINDERGARTEN
0.4/ 100
METRIC RATING
263rd/ 347
METRIC RANK
97.3%
KINDERGARTEN
0.0/ 100
METRIC RATING
292nd/ 347
METRIC RANK
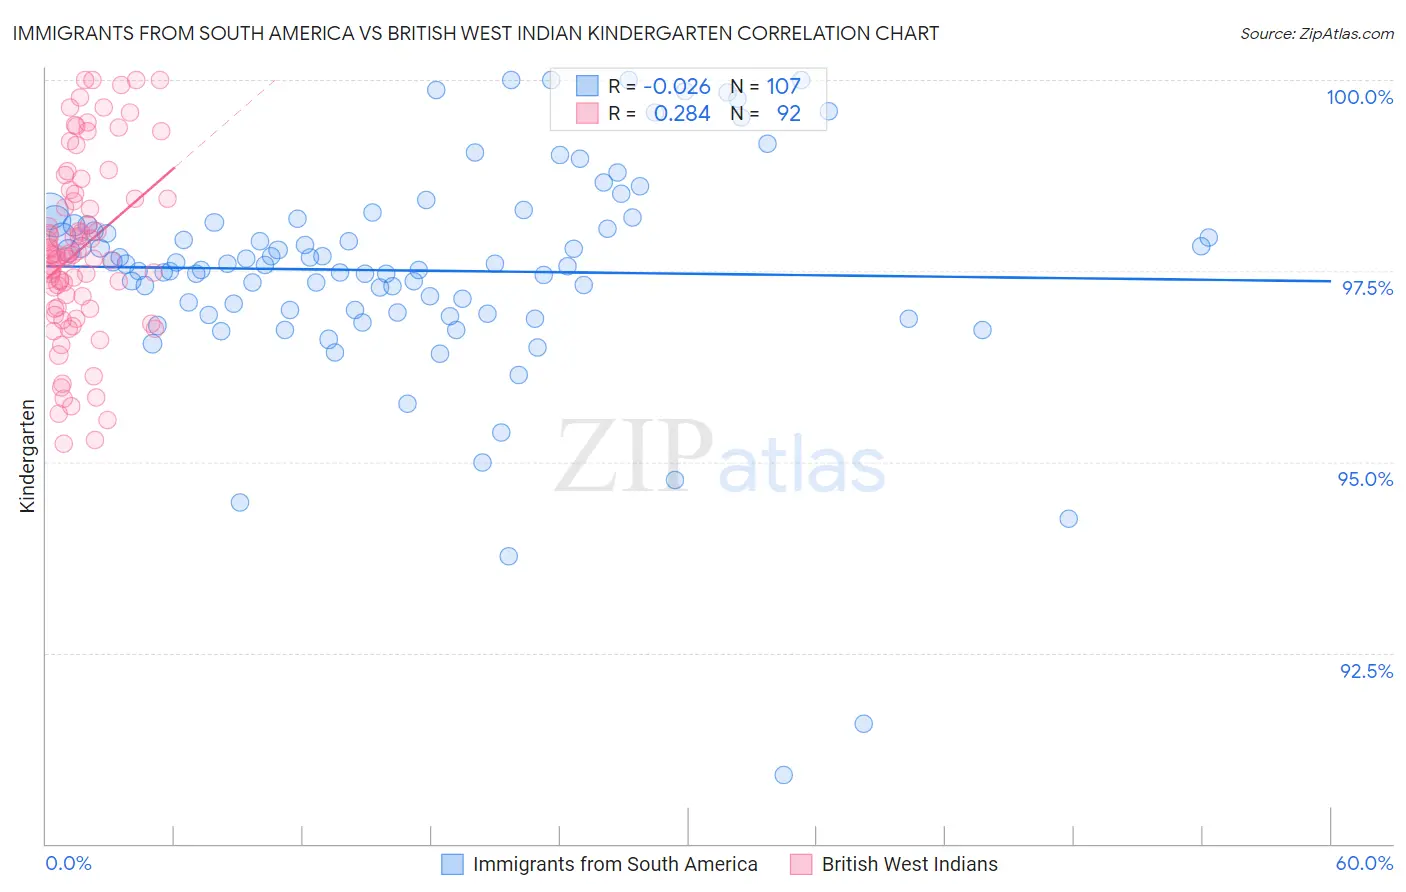
Immigrants from South America vs British West Indian Kindergarten Correlation Chart
The statistical analysis conducted on geographies consisting of 486,429,719 people shows no correlation between the proportion of Immigrants from South America and percentage of population with at least kindergarten education in the United States with a correlation coefficient (R) of -0.026 and weighted average of 97.5%. Similarly, the statistical analysis conducted on geographies consisting of 152,691,173 people shows a weak positive correlation between the proportion of British West Indians and percentage of population with at least kindergarten education in the United States with a correlation coefficient (R) of 0.284 and weighted average of 97.3%, a difference of 0.29%.
Kindergarten Correlation Summary
| Measurement | Immigrants from South America | British West Indian |
| Minimum | 90.9% | 95.2% |
| Maximum | 100.0% | 100.0% |
| Range | 9.1% | 4.8% |
| Mean | 97.5% | 97.8% |
| Median | 97.6% | 97.7% |
| Interquartile 25% (IQ1) | 97.0% | 97.0% |
| Interquartile 75% (IQ3) | 98.1% | 98.5% |
| Interquartile Range (IQR) | 1.2% | 1.5% |
| Standard Deviation (Sample) | 1.5% | 1.2% |
| Standard Deviation (Population) | 1.5% | 1.2% |
Similar Demographics by Kindergarten
Demographics Similar to Immigrants from South America by Kindergarten
In terms of kindergarten, the demographic groups most similar to Immigrants from South America are Taiwanese (97.5%, a difference of 0.0%), Immigrants from Ethiopia (97.5%, a difference of 0.0%), Assyrian/Chaldean/Syriac (97.5%, a difference of 0.0%), Armenian (97.6%, a difference of 0.010%), and Fijian (97.5%, a difference of 0.010%).
| Demographics | Rating | Rank | Kindergarten |
| Yaqui | 0.7 /100 | #256 | Tragic 97.6% |
| Immigrants | Colombia | 0.6 /100 | #257 | Tragic 97.6% |
| Jamaicans | 0.6 /100 | #258 | Tragic 97.6% |
| Armenians | 0.5 /100 | #259 | Tragic 97.6% |
| Fijians | 0.5 /100 | #260 | Tragic 97.5% |
| Taiwanese | 0.4 /100 | #261 | Tragic 97.5% |
| Immigrants | Ethiopia | 0.4 /100 | #262 | Tragic 97.5% |
| Immigrants | South America | 0.4 /100 | #263 | Tragic 97.5% |
| Assyrians/Chaldeans/Syriacs | 0.4 /100 | #264 | Tragic 97.5% |
| Cubans | 0.3 /100 | #265 | Tragic 97.5% |
| Immigrants | Sierra Leone | 0.3 /100 | #266 | Tragic 97.5% |
| Immigrants | Liberia | 0.3 /100 | #267 | Tragic 97.5% |
| Immigrants | Nigeria | 0.3 /100 | #268 | Tragic 97.5% |
| West Indians | 0.3 /100 | #269 | Tragic 97.5% |
| Immigrants | Jamaica | 0.2 /100 | #270 | Tragic 97.5% |
Demographics Similar to British West Indians by Kindergarten
In terms of kindergarten, the demographic groups most similar to British West Indians are Houma (97.3%, a difference of 0.010%), Malaysian (97.2%, a difference of 0.010%), Immigrants from St. Vincent and the Grenadines (97.3%, a difference of 0.030%), Immigrants from Afghanistan (97.3%, a difference of 0.040%), and Immigrants (97.2%, a difference of 0.040%).
| Demographics | Rating | Rank | Kindergarten |
| Immigrants | Portugal | 0.0 /100 | #285 | Tragic 97.3% |
| Immigrants | Barbados | 0.0 /100 | #286 | Tragic 97.3% |
| Immigrants | Hong Kong | 0.0 /100 | #287 | Tragic 97.3% |
| Immigrants | Thailand | 0.0 /100 | #288 | Tragic 97.3% |
| Immigrants | Afghanistan | 0.0 /100 | #289 | Tragic 97.3% |
| Immigrants | St. Vincent and the Grenadines | 0.0 /100 | #290 | Tragic 97.3% |
| Houma | 0.0 /100 | #291 | Tragic 97.3% |
| British West Indians | 0.0 /100 | #292 | Tragic 97.3% |
| Malaysians | 0.0 /100 | #293 | Tragic 97.2% |
| Immigrants | Immigrants | 0.0 /100 | #294 | Tragic 97.2% |
| Immigrants | Grenada | 0.0 /100 | #295 | Tragic 97.2% |
| Immigrants | Eritrea | 0.0 /100 | #296 | Tragic 97.2% |
| Central American Indians | 0.0 /100 | #297 | Tragic 97.2% |
| Immigrants | Dominica | 0.0 /100 | #298 | Tragic 97.1% |
| Immigrants | Cuba | 0.0 /100 | #299 | Tragic 97.1% |