Immigrants from South Africa vs Spaniard 8th Grade
COMPARE
Immigrants from South Africa
Spaniard
8th Grade
8th Grade Comparison
Immigrants from South Africa
Spaniards
96.5%
8TH GRADE
99.1/ 100
METRIC RATING
85th/ 347
METRIC RANK
95.8%
8TH GRADE
60.0/ 100
METRIC RATING
167th/ 347
METRIC RANK
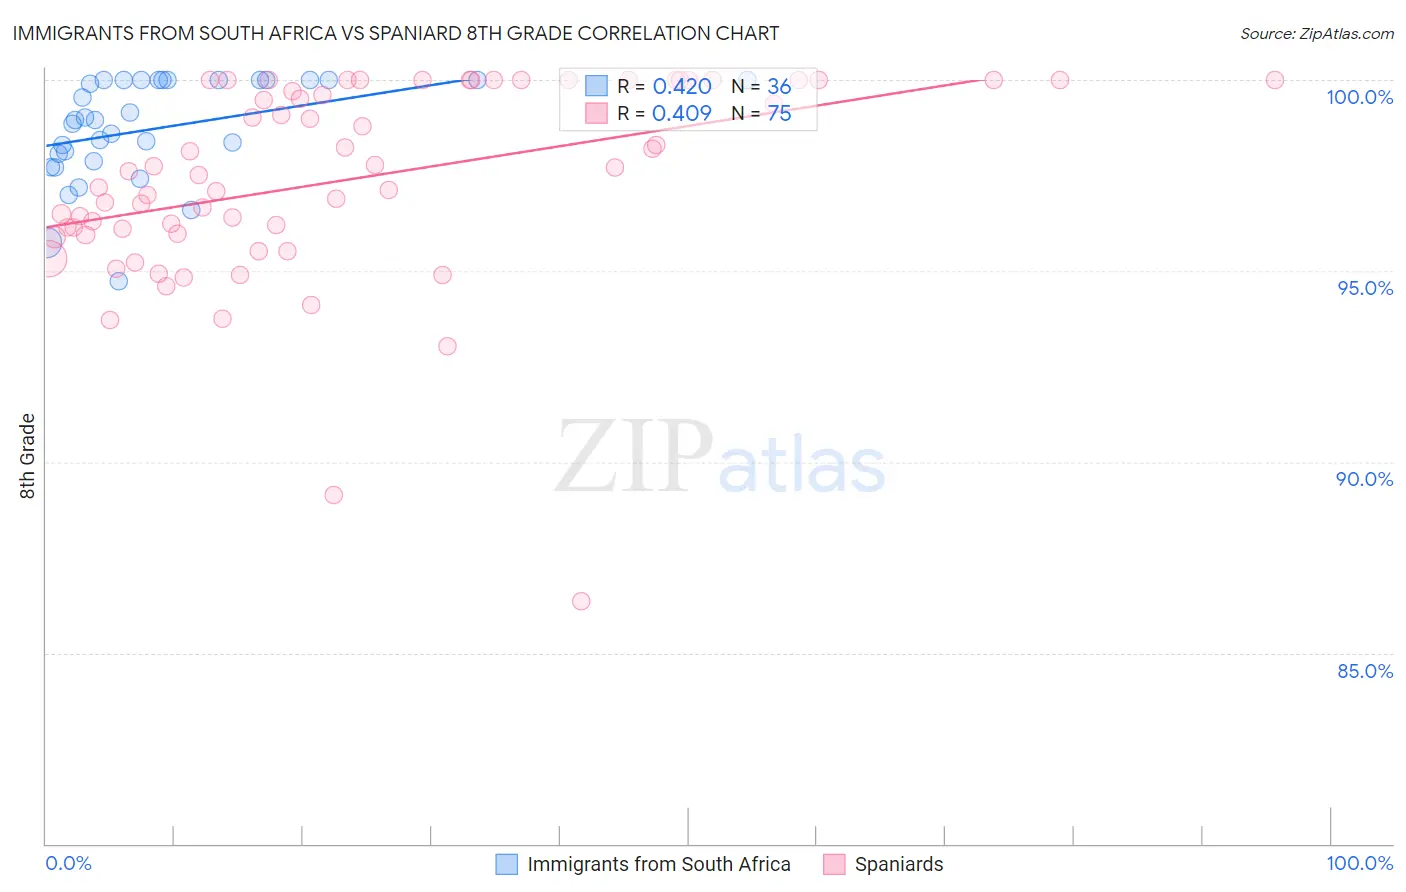
Immigrants from South Africa vs Spaniard 8th Grade Correlation Chart
The statistical analysis conducted on geographies consisting of 233,321,693 people shows a moderate positive correlation between the proportion of Immigrants from South Africa and percentage of population with at least 8th grade education in the United States with a correlation coefficient (R) of 0.420 and weighted average of 96.5%. Similarly, the statistical analysis conducted on geographies consisting of 443,544,503 people shows a moderate positive correlation between the proportion of Spaniards and percentage of population with at least 8th grade education in the United States with a correlation coefficient (R) of 0.409 and weighted average of 95.8%, a difference of 0.69%.
8th Grade Correlation Summary
| Measurement | Immigrants from South Africa | Spaniard |
| Minimum | 94.7% | 86.4% |
| Maximum | 100.0% | 100.0% |
| Range | 5.3% | 13.6% |
| Mean | 98.7% | 97.4% |
| Median | 98.9% | 97.6% |
| Interquartile 25% (IQ1) | 98.0% | 96.0% |
| Interquartile 75% (IQ3) | 100.0% | 100.0% |
| Interquartile Range (IQR) | 2.0% | 4.0% |
| Standard Deviation (Sample) | 1.4% | 2.6% |
| Standard Deviation (Population) | 1.3% | 2.6% |
Similar Demographics by 8th Grade
Demographics Similar to Immigrants from South Africa by 8th Grade
In terms of 8th grade, the demographic groups most similar to Immigrants from South Africa are Cherokee (96.5%, a difference of 0.0%), Immigrants from Australia (96.5%, a difference of 0.0%), Immigrants from Belgium (96.5%, a difference of 0.010%), Icelander (96.5%, a difference of 0.020%), and Immigrants from Western Europe (96.4%, a difference of 0.020%).
| Demographics | Rating | Rank | 8th Grade |
| Yugoslavians | 99.4 /100 | #78 | Exceptional 96.5% |
| Puget Sound Salish | 99.3 /100 | #79 | Exceptional 96.5% |
| Delaware | 99.2 /100 | #80 | Exceptional 96.5% |
| Romanians | 99.2 /100 | #81 | Exceptional 96.5% |
| Turks | 99.2 /100 | #82 | Exceptional 96.5% |
| Icelanders | 99.2 /100 | #83 | Exceptional 96.5% |
| Immigrants | Belgium | 99.1 /100 | #84 | Exceptional 96.5% |
| Immigrants | South Africa | 99.1 /100 | #85 | Exceptional 96.5% |
| Cherokee | 99.0 /100 | #86 | Exceptional 96.5% |
| Immigrants | Australia | 99.0 /100 | #87 | Exceptional 96.5% |
| Immigrants | Western Europe | 99.0 /100 | #88 | Exceptional 96.4% |
| Chickasaw | 98.9 /100 | #89 | Exceptional 96.4% |
| Immigrants | Sweden | 98.9 /100 | #90 | Exceptional 96.4% |
| Thais | 98.9 /100 | #91 | Exceptional 96.4% |
| Menominee | 98.9 /100 | #92 | Exceptional 96.4% |
Demographics Similar to Spaniards by 8th Grade
In terms of 8th grade, the demographic groups most similar to Spaniards are Immigrants from Ukraine (95.8%, a difference of 0.0%), Alsatian (95.8%, a difference of 0.010%), Immigrants from Poland (95.8%, a difference of 0.010%), Immigrants from Iran (95.8%, a difference of 0.010%), and Ute (95.8%, a difference of 0.010%).
| Demographics | Rating | Rank | 8th Grade |
| Seminole | 67.7 /100 | #160 | Good 95.8% |
| Bermudans | 67.5 /100 | #161 | Good 95.8% |
| Immigrants | Kenya | 67.2 /100 | #162 | Good 95.8% |
| Immigrants | Sri Lanka | 64.1 /100 | #163 | Good 95.8% |
| Immigrants | Italy | 63.5 /100 | #164 | Good 95.8% |
| Alsatians | 61.4 /100 | #165 | Good 95.8% |
| Immigrants | Poland | 61.1 /100 | #166 | Good 95.8% |
| Spaniards | 60.0 /100 | #167 | Good 95.8% |
| Immigrants | Ukraine | 59.5 /100 | #168 | Average 95.8% |
| Immigrants | Iran | 58.6 /100 | #169 | Average 95.8% |
| Ute | 58.5 /100 | #170 | Average 95.8% |
| Egyptians | 58.2 /100 | #171 | Average 95.8% |
| Immigrants | Korea | 57.9 /100 | #172 | Average 95.8% |
| Mongolians | 53.0 /100 | #173 | Average 95.8% |
| Chileans | 50.0 /100 | #174 | Average 95.7% |