Immigrants from South Africa vs Hawaiian 8th Grade
COMPARE
Immigrants from South Africa
Hawaiian
8th Grade
8th Grade Comparison
Immigrants from South Africa
Hawaiians
96.5%
8TH GRADE
99.1/ 100
METRIC RATING
85th/ 347
METRIC RANK
95.5%
8TH GRADE
16.7/ 100
METRIC RATING
204th/ 347
METRIC RANK
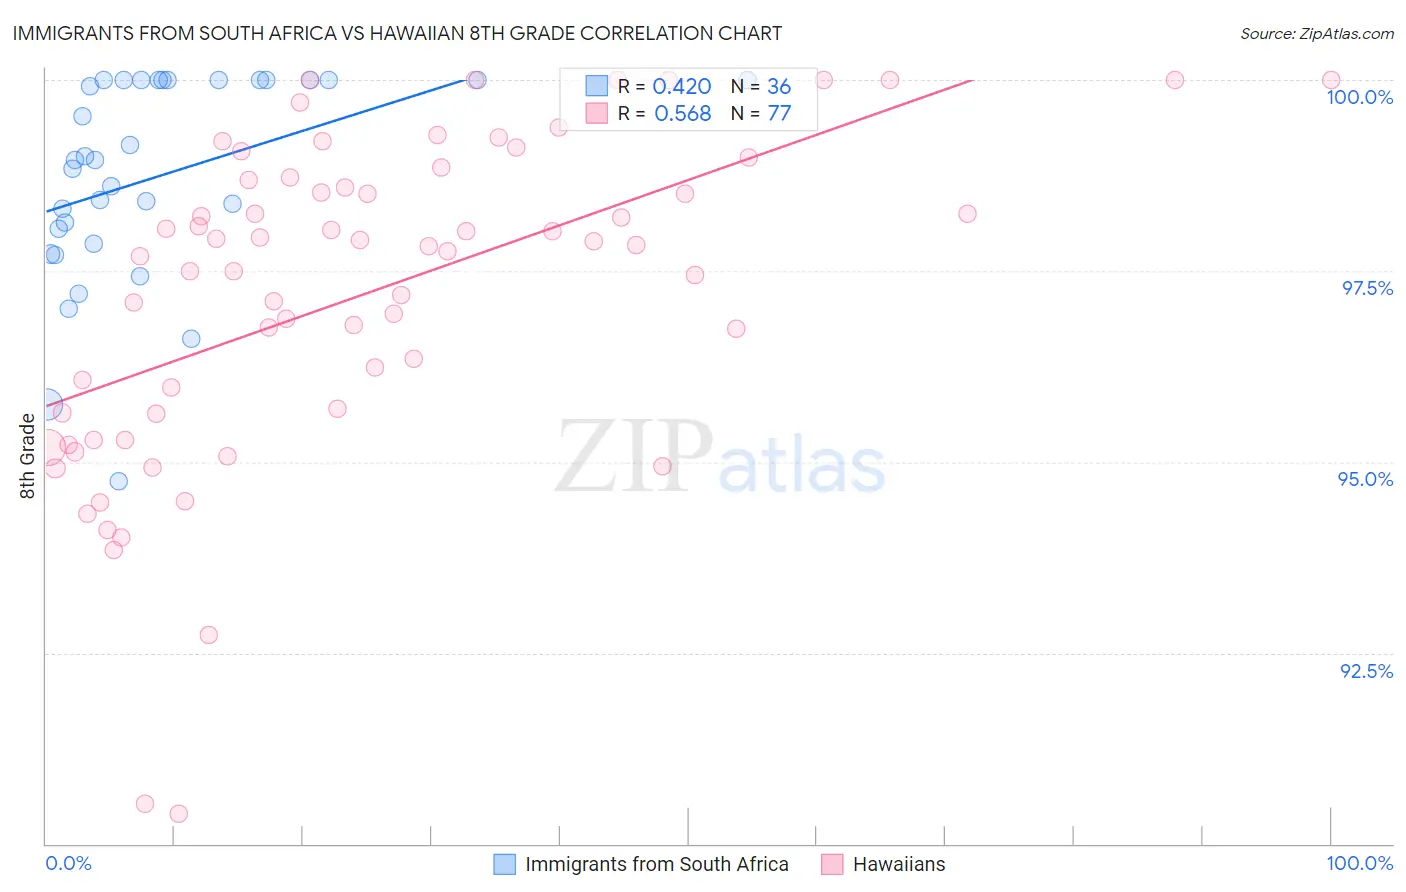
Immigrants from South Africa vs Hawaiian 8th Grade Correlation Chart
The statistical analysis conducted on geographies consisting of 233,321,693 people shows a moderate positive correlation between the proportion of Immigrants from South Africa and percentage of population with at least 8th grade education in the United States with a correlation coefficient (R) of 0.420 and weighted average of 96.5%. Similarly, the statistical analysis conducted on geographies consisting of 327,621,279 people shows a substantial positive correlation between the proportion of Hawaiians and percentage of population with at least 8th grade education in the United States with a correlation coefficient (R) of 0.568 and weighted average of 95.5%, a difference of 1.0%.
8th Grade Correlation Summary
| Measurement | Immigrants from South Africa | Hawaiian |
| Minimum | 94.7% | 90.4% |
| Maximum | 100.0% | 100.0% |
| Range | 5.3% | 9.6% |
| Mean | 98.7% | 97.2% |
| Median | 98.9% | 97.8% |
| Interquartile 25% (IQ1) | 98.0% | 95.6% |
| Interquartile 75% (IQ3) | 100.0% | 98.7% |
| Interquartile Range (IQR) | 2.0% | 3.1% |
| Standard Deviation (Sample) | 1.4% | 2.1% |
| Standard Deviation (Population) | 1.3% | 2.1% |
Similar Demographics by 8th Grade
Demographics Similar to Immigrants from South Africa by 8th Grade
In terms of 8th grade, the demographic groups most similar to Immigrants from South Africa are Cherokee (96.5%, a difference of 0.0%), Immigrants from Australia (96.5%, a difference of 0.0%), Immigrants from Belgium (96.5%, a difference of 0.010%), Icelander (96.5%, a difference of 0.020%), and Immigrants from Western Europe (96.4%, a difference of 0.020%).
| Demographics | Rating | Rank | 8th Grade |
| Yugoslavians | 99.4 /100 | #78 | Exceptional 96.5% |
| Puget Sound Salish | 99.3 /100 | #79 | Exceptional 96.5% |
| Delaware | 99.2 /100 | #80 | Exceptional 96.5% |
| Romanians | 99.2 /100 | #81 | Exceptional 96.5% |
| Turks | 99.2 /100 | #82 | Exceptional 96.5% |
| Icelanders | 99.2 /100 | #83 | Exceptional 96.5% |
| Immigrants | Belgium | 99.1 /100 | #84 | Exceptional 96.5% |
| Immigrants | South Africa | 99.1 /100 | #85 | Exceptional 96.5% |
| Cherokee | 99.0 /100 | #86 | Exceptional 96.5% |
| Immigrants | Australia | 99.0 /100 | #87 | Exceptional 96.5% |
| Immigrants | Western Europe | 99.0 /100 | #88 | Exceptional 96.4% |
| Chickasaw | 98.9 /100 | #89 | Exceptional 96.4% |
| Immigrants | Sweden | 98.9 /100 | #90 | Exceptional 96.4% |
| Thais | 98.9 /100 | #91 | Exceptional 96.4% |
| Menominee | 98.9 /100 | #92 | Exceptional 96.4% |
Demographics Similar to Hawaiians by 8th Grade
In terms of 8th grade, the demographic groups most similar to Hawaiians are Immigrants from Bahamas (95.5%, a difference of 0.0%), Moroccan (95.5%, a difference of 0.010%), Comanche (95.5%, a difference of 0.010%), Immigrants from Sudan (95.5%, a difference of 0.020%), and Apache (95.5%, a difference of 0.030%).
| Demographics | Rating | Rank | 8th Grade |
| Sierra Leoneans | 24.3 /100 | #197 | Fair 95.6% |
| Paraguayans | 22.6 /100 | #198 | Fair 95.5% |
| Immigrants | Northern Africa | 22.5 /100 | #199 | Fair 95.5% |
| Argentineans | 22.2 /100 | #200 | Fair 95.5% |
| Immigrants | Argentina | 20.6 /100 | #201 | Fair 95.5% |
| Apache | 19.4 /100 | #202 | Poor 95.5% |
| Moroccans | 17.4 /100 | #203 | Poor 95.5% |
| Hawaiians | 16.7 /100 | #204 | Poor 95.5% |
| Immigrants | Bahamas | 16.7 /100 | #205 | Poor 95.5% |
| Comanche | 16.3 /100 | #206 | Poor 95.5% |
| Immigrants | Sudan | 15.1 /100 | #207 | Poor 95.5% |
| Portuguese | 14.3 /100 | #208 | Poor 95.5% |
| Immigrants | Lebanon | 13.7 /100 | #209 | Poor 95.4% |
| Africans | 13.6 /100 | #210 | Poor 95.4% |
| Immigrants | Morocco | 12.4 /100 | #211 | Poor 95.4% |